![]() Click
to view page images in PDF format.
Click
to view page images in PDF format.
Geochemical Characterization of Natural Gas: A Physical Multivariable Approach and its Applications in Maturity and Migration Estimates
Alain Prinzhofer,1 Marcio Rocha Mello,2 and Tikae Takaki2
Search and Discovery Article #40016, 2001
Adapted for online presentation from article of the same title by the same authors in AAPG Bulletin, v.. 84, no. 8 (August 2000), p. 1152-1172. This article is presented here together with article entitled "Why Light Hydrocarbons Do Not Form A Gas Phase After Diffusing Through Seals" (Search and Discovery # 40017, 2001) by Alton A. Brown as a forum for discussion of hydrocarbon migration.
1Division of Geology-Geochemistry, Institut Francais du Petrole, 1 and 4 Avenue de Bois Preau, 92852 Rueil Malmaison Cedex, France; e-mail: [email protected]
2Petrobras Research and Development Center - Cenpes, Cidade Universitaria, Quadra 7, Ilha do Fundao, 21949-900, Rio de Janeiro, RJ, Brazil.
Gas geochemistry has recently been shown to enhance information regarding the geological history of hydrocarbons. In this paper, graphical representations of physico-chemical processes affecting the chemical and isotopic signatures of natural gases are exemplified. These diagrams are based on experimental studies and the use of basic statistics to extract significant and synthetic parameters from the geochemical data. From 11 chemical and isotopic ratios, a statistical analysis (PCA) yields two very important parameters. The first parameter, using mainly the C2+ fraction of the gas, relates to maturity and the second parameter, involving the proportions and d13C values of methane, indicates mainly segregative migration. Positive values of the second parameter indicate that gases accumulated far from their source, whereas negative values correspond to residual gas pools after leakage of a part of the fluids. A tentative reconstruction of the gas history has been performed in two Brazilian basins: the Espirito Santo basin and part of the Reconcavo basin. The Espirito Santo basin is located on the passive continental margin of the Atlantic Ocean, and the Reconcavo basin corresponds to an intracontinental aborted rift. In both cases, the source rocks are mainly lacustrine, with thermal maturities ranging between the oil window and the beginning of the gas window. Results show that in the Reconcavo basin, a major fault (the Mata Catu fault) acts as a drain for hydrocarbon migration at the basin scale, associating a major isotopic fractionation to the gas migration with a clear correlation between isotope fractionation and the distance of migration. In the Espirito Santo basin, this segregation appears in the platform sediments to a lesser extent and is absent in the gas pools located in the paleocanyons filled with turbidites. This long-distance migration in the platform sediments suggests that a hydrocarbon kitchen is located offshore.
 Figure 2--Simplified
scheme of genetic events occurring during the thermal degradation of organic
matter modeled in the diagram
Figure 2--Simplified
scheme of genetic events occurring during the thermal degradation of organic
matter modeled in the diagram 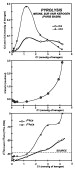 Figure 3--Results of
dry confined pyrolyses of a type II kerogen from Mesnil sur Vair (Paris Basin,
France), representing the chemical and isotopic behavior of the two isomers of
butane (from F. Lorant and C. Sulzer, 1999, personal communication).
Figure 3--Results of
dry confined pyrolyses of a type II kerogen from Mesnil sur Vair (Paris Basin,
France), representing the chemical and isotopic behavior of the two isomers of
butane (from F. Lorant and C. Sulzer, 1999, personal communication).
 Figure 4--Calculation
of mixing and diffusion trends in a diagram C2/C1 vs.
Figure 4--Calculation
of mixing and diffusion trends in a diagram C2/C1 vs.

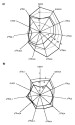 Figure 7--Two examples
of normalized Gastar diagrams for two series of gases coming from two different
fields. (a) A regular increase of maturity can be seen from gas I to gas V. (b)
The influence of a more confined generation can be seen from gas I to gas III on
the positions of the diagrams. The scales are the same for all 11 axes of each
Gastar diagram.
Figure 7--Two examples
of normalized Gastar diagrams for two series of gases coming from two different
fields. (a) A regular increase of maturity can be seen from gas I to gas V. (b)
The influence of a more confined generation can be seen from gas I to gas III on
the positions of the diagrams. The scales are the same for all 11 axes of each
Gastar diagram.
 Figure 9--Plot of the
covariances between the
Figure 9--Plot of the
covariances between the  Figure 10--Experimental
data represented in a V1-V2 diagram. The experimental circles come from dry
confined system pyrolyses of the type II Mesnil sur Vair kerogen having various
times and temperature ranges. Diamonds correspond to gases having migrated in
saturated shales, considering that relative proportions and isotopic ratios of
propane and of the two butane isomers are not modified by the process (Pernaton
et al., 1996). The two main Eigen vectors, V1 and V2, may be assimilated to
maturity trends and segregative trends, respectively.
Figure 10--Experimental
data represented in a V1-V2 diagram. The experimental circles come from dry
confined system pyrolyses of the type II Mesnil sur Vair kerogen having various
times and temperature ranges. Diamonds correspond to gases having migrated in
saturated shales, considering that relative proportions and isotopic ratios of
propane and of the two butane isomers are not modified by the process (Pernaton
et al., 1996). The two main Eigen vectors, V1 and V2, may be assimilated to
maturity trends and segregative trends, respectively. Figure 11--Geographical
location and simplified geological map of the Espirito Santo basin (modified
from Estrella et al., 1984).
Figure 11--Geographical
location and simplified geological map of the Espirito Santo basin (modified
from Estrella et al., 1984).
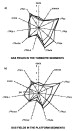 Figure 12--Normalized
Gastar diagrams of gases from the Espirito Santo basin. (a) Gases collected from
fields located in the turbiditic sequences of the paleocanyons with maturity
variations and minor segregations. (b) Gases collected in fields located in the
platform sediments with both maturity and segregation variations. The scales are
the same for all 11 axes of each Gastar diagram.
Figure 12--Normalized
Gastar diagrams of gases from the Espirito Santo basin. (a) Gases collected from
fields located in the turbiditic sequences of the paleocanyons with maturity
variations and minor segregations. (b) Gases collected in fields located in the
platform sediments with both maturity and segregation variations. The scales are
the same for all 11 axes of each Gastar diagram.
 Figure 13--PCA
(principal components analysis) representation of gases from the Espirito Santo
basin. The gases located in the platform sediments show an oblique trend,
indicating fractionation during migration, and the gases located in two
paleocanyons show two parallel horizontal trends, indicating only maturity
gradient with no evidence of segregation due to transport.
Figure 13--PCA
(principal components analysis) representation of gases from the Espirito Santo
basin. The gases located in the platform sediments show an oblique trend,
indicating fractionation during migration, and the gases located in two
paleocanyons show two parallel horizontal trends, indicating only maturity
gradient with no evidence of segregation due to transport.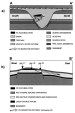 Figure 14--Geological
cross sections through the Espirito Santo basin (after Estrella et al., 1984).
(a) Cross section through a paleocanyon filled with turbidite sediments showing
the short migration of hydrocarbons from the disconformity between the
lacustrine shales and turbidites into the reservoirs. (b) Cross section through
the platform sediments showing the long migration distance and the direction of
filling from east to west.
Figure 14--Geological
cross sections through the Espirito Santo basin (after Estrella et al., 1984).
(a) Cross section through a paleocanyon filled with turbidite sediments showing
the short migration of hydrocarbons from the disconformity between the
lacustrine shales and turbidites into the reservoirs. (b) Cross section through
the platform sediments showing the long migration distance and the direction of
filling from east to west.  Figure
15--Geographical location and simplified geological map of the Reconcavo basin.
Figure
15--Geographical location and simplified geological map of the Reconcavo basin.
 Figure
16--Gastar diagram for data from the Reconcavo basin. (a) Gases located in
fields in a transection perpendicular to the Mata Catu fault with no evidence of
segregation due to migration and showing only maturity gradient. (b) Gases
located along the Mata Catu fault with a clear scatter between maturity
parameters (right part of the diagram) and migration parameters (left part of
the diagram). The scales are the same for all 11 axes of each Gastar diagram.
Figure
16--Gastar diagram for data from the Reconcavo basin. (a) Gases located in
fields in a transection perpendicular to the Mata Catu fault with no evidence of
segregation due to migration and showing only maturity gradient. (b) Gases
located along the Mata Catu fault with a clear scatter between maturity
parameters (right part of the diagram) and migration parameters (left part of
the diagram). The scales are the same for all 11 axes of each Gastar diagram.
 Figure
17--PCA (principal component analysis) representation for gases from the
southern part of the Rec¶ncavo basin. The gases perpendicular to the Mata Catu
fault exhibit a pure maturity trend, whereas the gases along the fault show a
large range of variation in the V2 values indicating strong fractionation during
migration.
Figure
17--PCA (principal component analysis) representation for gases from the
southern part of the Rec¶ncavo basin. The gases perpendicular to the Mata Catu
fault exhibit a pure maturity trend, whereas the gases along the fault show a
large range of variation in the V2 values indicating strong fractionation during
migration. Figure
18--V2 values of the gases from Reconcavo located along the Mata Catu fault vs.
their position along the fault (the zero value on the X-axis represents the
deepest part of the kitchen along a cross section located along the Mata Catu
fault).
Figure
18--V2 values of the gases from Reconcavo located along the Mata Catu fault vs.
their position along the fault (the zero value on the X-axis represents the
deepest part of the kitchen along a cross section located along the Mata Catu
fault). 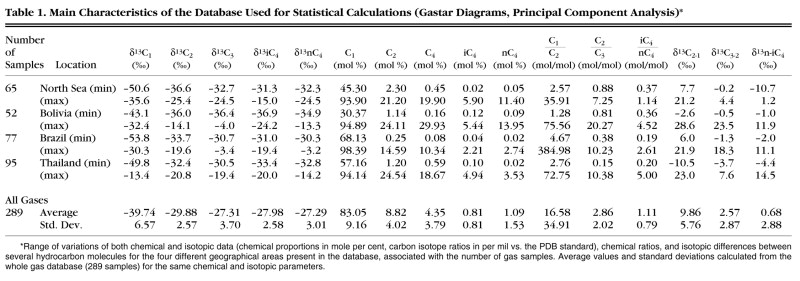
Physico-Chemical Processes in Gas History and Their Experimental Control
Defining a Set of Possible Parameters
Parameters Relating to Maturity
Parameters Relating to the Efficiency of Accumulation
Parameters for the Segregation Processes During Migration
A First Approach: The Gastar Diagram
Multicomponents analysis: Principle and Results
Geological Examples: The Link Among Physics, Statistics, and Geology
Gas geochemistry has become an increasingly sophisticated tool for understanding the geological history of hydrocarbons from their generation in source rocks to their accumulations in reservoirs. Interpretation of gas compositions is also an important factor in drilling operations because it is the foremost information used in mud logging. Because the complex history of gases is often difficult to decipher with the few chemical indicators that are available in routine gas analysis, an effort has been made for a better understanding of the chemistry and physics inducing the variability of gas compositions. For decades, the two main gas indicators were the wetness of the gas ([C2-C5]/[C1-C5]) and the carbon isotopic composition of methane, expressed in part per mil vs. the PDB standard. Source, thermal maturity, and possible bacterial contamination were evidenced from their respective variations (Stahl and Carey, 1975; Schoell, 1983; Mattavelli et al., 1983; Faber et al., 1992). The addition of other parameters, such as the d13C of ethane or propane (James, 1983; Faber, 1987; Clayton, 1991; Berner et al., 1992, 1995) and the hydrogen isotopic composition of methane (Schoell, 1980) or of ethane and propane (Barker and Pollock, 1984; Prinzhofer and Huc, 1995), was also suggested for a better characterization of the gas history; however, a systematic control on these parameters was only recently developed from experimental studies and associated modeling (Clayton, 1991; Berner et al., 1995; Lorant et al., 1998), although few available studies use the whole range of parameters (proportions of each compound, isomer ratio, isotopic value). An interpretation of the whole chemical and carbon isotopic gas data is thus very rarely completed. Hydrogen isotopic ratios are even less common and are probably often scattered by large uncertainties induced by sample preparation and measurements.
The development of new analytical tools, such as the GC-C-IRMS (gas chromatograph-combustion interface-isotopic ratio mass spectrometer), gives easy access to the whole set of d13C for the C1-C4 range and CO2. More conventional determinations of the chemical proportions are also possible for all molecules present, even in minor amounts in a gas sample using classical gas chromatography. In addition, new experimental studies of physical and chemical processes have been obtained to get the best information from all the chemical and isotopic parameters (Clayton, 1991; Berner et al., 1995; Prinzhofer and Pernaton, 1997; Prinzhofer and Lorant, 1997; Lorant et al., 1998). The recent increase in analytical and experimental information on gas chemistry and isotopic ratios, however, renders the interpretations more complex, largely because of the increasing amount of different kinds of data. We present here a new attempt to represent graphically the variability of gas compositions under the constraints of physico-chemical processes tested and calibrated on laboratory experiments. Simple statistical treatment of natural gas data provides a set of synthetic parameters involving both chemical and isotopic measurements. We chose to describe results of gas data using both star-diagrams applied to gas (Gastar diagrams) and principal components analysis to easily interpret the main characteristics in a series of natural gases. Some applications used in areas of Brazil are described to demonstrate the interest in this new approach for describing gas heterogeneities.
PHYSICO-CHEMICAL PROCESSES IN GAS HISTORY AND THEIR EXPERIMENTAL CONTROL
Genesis in the source rock, expulsion, migration, accumulation, alteration, and leakage are potential segregative processes leading to specific gas chemical and isotopic evolutions varying from one occurrence to another (Figure 1). Three possible origins may be envisaged for thermogenic gases generated in the source rock (Clayton, 1991; Behar et al., 1992): gas coming from the kerogen in association with the oil genesis (gas 1), late gas generation from the kerogen after the first oil generation that is mainly composed of methane (gas 2), and gas generated by the thermal degradation of the oil or a part of the oil (generally the heavier compounds) remaining in the source (gas 3). Although these gases are expelled from the source rock, a part of them may remain adsorbed on the organic matter (Friedrich and Juntgen, 1972), inducing a first segregation process. Hydrocarbon migration from the source rocks to the reservoirs through porous rocks forming the drains may also induce different segregations due to transport, dispersion, and retention (Bondar, 1987). In the reservoir, a fourth hydrocarbon gas fraction may be found coming from the in situ thermal decomposition of the oil (gas 4). The accumulated gas mixture may be affected by segregative loss through the wall of the accumulation (cap rocks or water contact) and may be contaminated by an influx of bacterial gas if the reservoir is shallow enough.
The main problem with gas interpretation today is the outstanding number of unknowns that are greater than the commonly measurable number of data types. Looking at the hydrocarbon part of the gas C1-C4, nine independent parameters are available (chemical proportions normalized to 100%, i.e., four independent values and five carbon isotopic ratios). Several case studies, in fact, have dealt with the origins and accumulation occurrence of natural gas using these nine parameters. James (1983, 1990) suggested using the carbon isotopic difference between each gas hydrocarbon to determine an equivalent maturity of its source rocks. The carbon isotopic ratio of methane, enriched in 13C when maturity increases, has been calibrated through various works in terms of thermal stress (Franck et al., 1974; Chung and Sackett, 1979; Schoell, 1983). The C2-C4 carbon isotopic information (any d13C becomes less negative with increasing maturity), regardless of association with the methane isotopic information, has also been used and modeled for the purpose of characterizing the transformation ratio of the gas source (Galimov, 1975; Faber, 1987; Clayton, 1991; Rooney et al., 1995; Berner et al., 1995; Prinzhofer and Huc, 1995; Prinzhofer and Lorant, 1997; Lorant et al., 1998). The modeling of the isotope fractionation was done assuming thermodynamic equilibrium (James, 1983; Galimov, 1975) or a purely kinetic control (Clayton, 1991; Berner et al., 1995; Rooney et al., 1995; Lorant et al., 1998). Although these approaches give coherent qualitative behaviors, no reliable quantification of the maturity of gases can be claimed.
Because different natural (Colombo et al., 1970, Friedrich and Juntgen, 1972; Prinzhofer and Pernaton, 1997) and experimental (Hoering and Moore, 1958; Galimov, 1975; Pernaton et al., 1996; Krooss et al., 1998) evidence has suggested that methane could be affected by several secondary changes in its chemical proportion and in its isotopic ratios (bacterial contamination, segregative migration), after Prinzhofer and Huc (1995), Prinzhofer and Lorant (1997), and Lorant et al. (1998), we suggest using mainly the C2+ fraction to characterize the genetic processes. Using both the chemical and isotopic proportions of ethane and propane, Lorant et al. (1998) pointed out the importance of another variable, the degree of opening of the system. This variable characterizes two distinct phenomena: the ability of generated molecules to react and transform themselves after being generated (as secondary thermal alteration), and the fact that the gas present today in a reservoir may correspond to an intermediate between the lately generated gas and the sum of the whole gas generated from the beginning of the oil window to the present. The first attempt to describe the dynamics of gas accumulation in a semiopen system was made by Galimov (1988) and Rooney et al. (1995). They described a semiopen accumulation in a reservoir, whereas Lorant et al. (1998) described the residence time of gases in the source rocks. For this purpose, Lorant et al. modeled the possible trend of maturation in a d13C2-d13C3 vs. C2/C3 diagram, as was suggested by Prinzhofer and Huc (1995) with natural gas series. In the Y-axis, the difference of d13C is plotted between two molecules (which reduces source heterogeneities effects to a second-order effect) vs. the ratio C2/C3 for the X-axis, thus avoiding the problem of the normalization to 100% of all individual gas molecules. A mathematical modeling, based on closed-system pyrolysis experiment data, outlines different areas of genesis for given thermal conditions (Figure 2) corresponding to the main zone of primary cracking of kerogen, the secondary cracking of heavy oil compounds (NSO heteroatomic molecules), or the hydrocarbon part of the oils cracking, up to later stages of thermal degradation corresponding to the secondary cracking of the C2+ fraction of the gas. The maturity is correlated to vitrinite reflectance as an index. The degree of opening of the system, equivalent to the residence time of the gas, may be deduced qualitatively from the positions of gas signatures between the open-system and the closed-system trends. Closed-system pyrolysis experiments have also shown that the butane isomers evolve with an increase in (1) the iC4/nC4 ratio, (2) the 13C proportion of each compound, and (3) the isotopic difference between nC4 and iC4 with maturation (Figure 3).
The C2+ gas fraction holds information on the genesis of hydrocarbons. The isotopic signature of methane, however, distinguishes segregation processes during the migration from a possible contamination by bacterial gas or from a simple maturity trend. A C2/C1 diagram vs. the d13C of methane makes it possible to distinguish these three possible trends (Prinzhofer and Pernaton, 1997): (1) a straight line when plotted in normal scales, characteristic of a mixing trend between two end members (for example thermogenic and bacterial end-members) and (2) a diffusive fractionating migration would show a concave-shaped curve (Figure 4a). In a semilogarithmic scale (Figure 4b), diffusive fractionation trends plot straight lines, whereas mixing trends make convex curves. (3) The slope is always reversed to both bacterial mixing and diffusive fractionation in a simple maturity trend (Figure 4). The whole subject of gas segregation, in fact, revives the debate about the existence or the importance of isotopic and chemical fractionation during migration (Colombo et al., 1965, 1966, 1970; Neglia, 1979; Fuex, 1980; Reitsema et al., 1981; Ricchiuto and Schoell, 1988; Pernaton et al, 1996; Prinzhofer and Pernaton, 1997). One of the major arguments opposing this concept views the gas transport through buoyancy as a process without chemical or isotopic fractionation. Fractionation may happen only conjunctively with diffusion and adsorption. The relative importance of these two processes, however, is still not fully understood. Adsorption is a very poorly known process in terms of quantitative importance except in coal layers, where chemical and isotopic fractionations have been proven (Colombo et al., 1970; Friedrich and Juntgen, 1972). Diffusion in a gas phase or in dry rocks introduces significant fractionation (Pernaton et al., 1996), but its time scale seems very short compared to geological time. This rapid process, in fact, would induce a quasi-immediate equilibrium at the geological scale without any remaining fractionation. Diffusion of some gas molecules when they are dissolved in water (mainly methane, for which the solubility may be large at high pressures) is another realistic way of having an isotopic fractionation (Pernaton et al., 1996); however, in this case, the duration of the process is also debated when compared to reasonable geological time scales. Some workers argue that, contrary to the previous case of gas diffusion, the duration of the process may be too long compared to geological time (Krooss et al., 1992), whereas other workers would consider that this process of solubilization/diffusion is very efficient for secondary gas migration (Nelson and Simmons, 1992, 1995; Prinzhofer et al., 1995; Schneider et al., 1995). In addition, diffusion may be considered as a dispersive phenomenon rendering the concept of a new accumulation of a gas pool difficult to conceive. Our objective in this paper is to present how an effective transport process involving fractionation through diffusion in water can occur together with a new accumulation partially generated with this process. Figure 5 shows the profile of fluid pressure through a lithostatic sedimentary column disrupted with a gas pool. The pressure gradient through the gas leg is steeper due to the low density of gas compared to water. An overpressure due to buoyancy exists at the interface between the gas leg and the seal, and the gas leg is stable if the capillary pressure (or entrance pressure) of the seal is equal or greater than the overpressure due to the gas leg. Whatever the entrance pressure, however, the overpressure locally increases the solubilization of the gas compounds in the water of the seal. The solubilized gas then diffuses through the water network of the seal. As the fluid pressure decreases through the seal to reach the hydrostatic pressure, the diffusion of dissolved gas, within a very short distance, will crosscut its saturation curve in water because this saturation will decrease as a function of the pressure. Gas molecules will then generate yet another gas phase, which is capable of moving through buoyancy without any fractionation. At a macroscopic scale, we see a gas flux through the cap rocks, which may be modeled by an ad hoc low relative permeability. The actual physical process observed, in fact, will be a very local solubilization/desolubilization of gas through the water at the lower end of cap rocks (this may be at the centimeter scale), giving the same macroscopic gas flux but inducing both chemical and isotopic fractionation. This fractionation will occur only at the point where the gas is dissolved in the water.
Because these new diagrams do not represent the whole information obtainable from a gas sample and never fully quantify all parameters involved in the gas history, in the attempt to get more reliable information on the different factors influencing the gas compositions, we propose to increase the number of physically significant geochemical data for natural gas. Our main suggestion is to quantify the maturity and the migrating fractionation and to tentatively estimate the yield of accumulation (or the degree of opening).
After defining a set of informative data, we present some statistical treatments that can then be applied to different case studies.
DEFINING A SET OF POSSIBLE PARAMETERS
The first issue to resolve is the choice of geochemical parameters evolving in a well-characterized (if not monotonous) way for the three main defined processes (maturity, efficiency of accumulation, and degree of segregation). The most appropriate set of parameters has been taken from experimental data for which the maturity conditions are well controlled, and for which we can consider that no other phenomena are superimposed; however, the problem of direct extrapolation of pyrolysis experiments (high temperatures, short durations) to geological conditions (lower temperatures and long-term scales) always reduces the possibility of quantitative extrapolation to natural case studies. For this reason, we do not present any quantitative values for maturity, efficiency of accumulation, or distance of migration.
Parameters Relating to Maturity
Gases become enriched in methane with increasing thermal maturity (Stahl and Carey, 1975; Stahl, 1977; Chung and Sackett, 1979); however, other phenomena (bacterial contamination, segregative migration) may affect the dryness of the gases. Instead of using the dryness of the gases, which corresponds to a mathematically relatively complex expression (C1/C1 - C5), we use the simple ratio C1/C2, which gives equivalent information and is easily correlated with the other chemical ratios, such as C2/C3 or iC4/nC4. The carbon isotopic signatures of individual hydrocarbons, such as methane, ethane, and propane, become isotopically heavier with increasing maturity (Chung and Sackett, 1979; Chung et al., 1988). From their experimental work, Lorant et al. (1998) showed that the difference of d13C between methane and ethane, and between ethane and propane, increases with maturity, at least for gas generation behaving as a relatively confined system. Arneth and Matzigkeit (1985) and Faber (1987) already described this kind of divergence of the d13C with maturity. Experimental and natural examples presented evidence that the C2/C3 ratio increased with maturity (Prinzhofer and Huc, 1995). Several other parameters involving the two butane isomers having a nonambiguous link with maturity were observed (Figure 3): the ratio iC4/nC4 and the two carbon isotopic ratios d13iC4 and d13nC4, as well as the isotopic difference between these two values, are positively correlated with maturity. In short, we may define 11 geochemical parameters, all of which are linked positively with maturity: C1/C2, C2/C3, iC4/nC4, d13C1, d13C2, d13C3, d13iC4, d13nC4, d13C2-d13C1, d13C3-d13C2, and d13nC4-d13iC4. Clearly, other processes, such as biodegradation, bacterial contamination, or segregative migration, may affect to some degree a number of these parameters.
Parameters Relating to the Efficiency of Accumulation
It has been observed (Lorant et al., 1998) that the difference of d13C between two consecutive components (d13C1-d13C2 and d13C2-d13C3) exhibits greater fractionation for a completely closed system (total accumulation of gas and possibility of secondary thermal alteration) than for an open system (isolation of the produced molecules from their source). The same kind of divergence is observed between the d13C of iC4 and nC4 in confined-system pyrolysis with values much higher than the source (Figure 3). Because this can be interpreted only as the result of secondary degradation of the two butane isomers, an open-system pyrolysis will give d13C trends without this secondary degradation inducing the observed divergence; therefore, 3 of the 11 previously defined parameters, d13C1-d13C2, d13C2-d13C3, and d13nC4-d13iC4, are interpreted as positively correlated with the efficiency of accumulation, as well as being correlated positively with maturity.
Parameters for the Segregation Processes During Migration
Segregative migration may affect the parameters involving methane (Galimov, 1975; Syngayevsky et al., 1978; Bondar, 1987; Pernaton et al., 1996) both chemically and isotopically with negligible fractionation for heavier hydrocarbons (Pernaton et al., 1996). Considering a gas system migrating through porous rocks with a part of it migrating through solubilization/diffusion in water, the migrating part of the gas will be enriched in methane, and this methane will be enriched in 12C (Galimov, 1975; Pernaton et al., 1996; Prinzhofer and Pernaton, 1997). Taking this into account, we can then say that d13C1, d13C2-d13C1, and C1/C2 may be strongly affected by migration. As a result, the distance of migration will be negatively correlated with the first of these three parameters, and positively correlated with the last two. As for the parameters correlated with the efficiency of accumulation, these three parameters are evidently also linked with both the thermal maturity and the segregation during transport.
A FIRST APPROACH: THE GASTAR DIAGRAM
We have defined and discussed 11 geochemical parameters (C2/C1, C2/C3, iC4/nC4, d13C1, d13C2, d13C3, d13iC4, d13nC4, d13C2-d13C3, d13nC4-d13iC4, and d13C2-d13C1), all positively correlated with maturity, three of them linked with the efficiency of accumulation (the three isotopic ratios differences), and three linked with the distance of migration (the three last parameters, involving methane). We decided to adapt for gas analyses a gas star diagram as commonly used for the C6-C18 fraction for oil fingerprinting (Kaufman et al., 1990; Magnier and Huc, 1995). Because carbon isotopic ratios of methane range between about 50 and 60 delta-units, and whereas the iC4/nC4 ratio will show a variation of only one unit, it is imperative for gas analyses to be normalized. To normalize all of these different values (chemical and isotopic, with very different ranges of variations), we chose the following normalization:
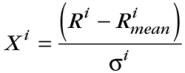
where Ri is the absolute value for the parameter i (chemical or isotopic ratio), is a mean value for the parameter i calculated from a general gas database, si is the standard deviation of parameter i within the same database, and Xi is the normalized value for the parameter i.
We used for this normalization a set of 289 gas analyses, each of them with all chemical proportions from methane to normal-butane, and all the C1-C4 carbon isotopic ratios. The locations of the samples are diverse, from the North Sea, Bolivia, Brazil, and Thailand. Table 1 gives the minimum and maximum values for both chemical and isotopic signatures of these gases for each of the different geographical locations. The average values and the standard deviations for the defined geochemical parameters are also given for the whole set of data.
The parameters were classified according to their behavior vs. the three defined parameters (maturity, efficiency of accumulation, and segregative migration). Figure 6 gives the basic principle of the star diagram (GASTAR diagram), exhibiting the monotonous variations of the 11 parameters with maturity and the direction of variation for some of the parameters with the efficiency of accumulation and the segregative migration. In the same diagram, the assumed analytical uncertainties for each parameter are represented. The star diagram for gases presented here, built on experimental constraints, allows us to distinguish different gases and to interpret the physico-chemical processes that affected the analyzed gas. The more usual star diagrams used for the C6+ part of oils are only a descriptive way of distinguishing oil heterogeneities through different fingerprinting.
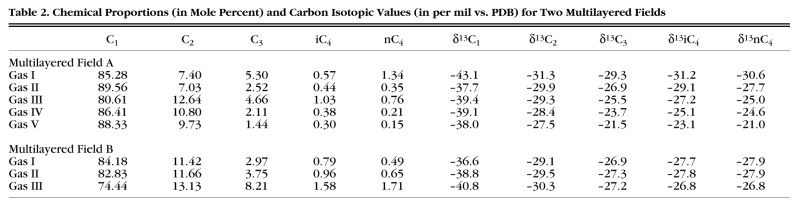
Figure 7 shows two examples of data (Table 2) plotted in this diagram. Figure 7a presents a series of natural gases coming from a multilayered reservoired field with a regular variation in maturity, with gas I and gas V being the less and the more mature, respectively; however, a slight disturbance interpreted as segregation during migration may be seen. Gas II, for example, has a heavier d13C of methane than every other gas, although it is one of the less mature. Thus, gas II looks similar to a residual gas after segregative leakage. Figure 7b corresponds to other gases from another multilayered field and shows different behaviors; no segregative fractionation can be noticed, but gas III seems to come from a reservoir with a better efficiency of accumulation than gases I and II. It seems then possible to build constraints on the quality of the accumulation induced by both the quality of the seal and the timing of gas generation.
MULTICOMPONENTS ANALYSIS: PRINCIPLE AND RESULTS
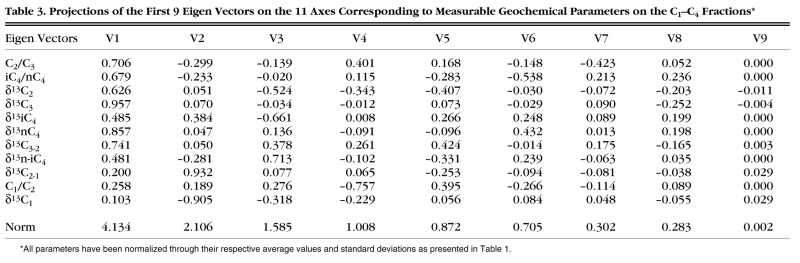
The Gastar diagrams should not be used when a large number of gas samples is available because the diagrams become overcharged. Another practical technique uses multicomponent analysis or principal components analysis (PCA). This mathematical statistical data processing allows one to represent a complex multidimensional database in the best chosen two-dimensional projection, as in, for example, a plane defined by the two largest spread dimensions of information from the cloud of initial data plotted in a hyperspace. The two principal vectors defining this plane are the first two Eigen vectors (Debart et al., 1984). With our gas database of 289 natural samples, we created a PCA with the 11 different normalized geochemical parameters by using the software Datadesk 4.1©. The projection of the Eigen vectors on the 11 primitive axes and the weight of each vector are presented in Table 3.
In looking at the composition of the first vector V1, we see that all 11 geochemical parameters are linked to it with a same positive sign (Figure 8). This point is interpreted as a positive link of all these 11 parameters with maturity; moreover, the relative importance of each geochemical parameter on the V1 vector concerns substantially the parameters using C2+ information with a lesser importance for parameters involving methane. This poor correlation between methane and the C2+ fraction is visible on Figure 9 for the isotopic ratios of all the C1-C4 compounds; furthermore, the covariances between C2, C3, nC4, and iC4 are relatively stable and in the same range, whereas methane is definitely not correlated with anything except itself. We conclude from this statistical treatment that the C2+ fraction is more efficient than methane to characterize maturity, and that the first Eigen vector defined in this study is a good qualitative indicator of maturity.
Likewise, when focusing on the projection of the 11 primary geochemical parameters onto the V2 axis (Figure 8, Table 3), the weight of all the C2+ parameters is much less than on the V1 axis. The parameters involving methane information, however, are mainly projected onto the V2 axis, and their directions are contrary to the horizontal axis. This is a clear indication that the V2 vector cannot be linked with maturity (d13C1, C1/C2, and d13C2-d13C1 should be on the same side of the V2 axis). V2 appears to be consistent with a fractionation due to migration because the migrating gas would be isotopically lighter in methane, only slightly affected by C2+ fractionation, and enriched in methane in comparison with C2+. A residual gas would exhibit opposite behavior. In conclusion, we assume that the second Eigen vector V2 is mainly controlled by migrative fractionations.
We should stress that this purely statistical treatment applied to natural data gives an excellent qualitative consistency with the independent assessments obtained from the physico-chemical interpretations of laboratory experiments. In this statistical approach, a mathematical calculation, insensitive to any physical constraints and set only on natural gas data, gives the same results as the experimental evidence. To illustrate this point, Figure 10 represents a series of laboratory pyrolyses with increasing maturity in a diagram V1-V2, obtained from dry-confined pyrolysis of a type II kerogen (Mesnil sur Vair, France). The trend defined is almost parallel to the V1 axis, with a slightly negative slope. A trend of experimental diffusive migration has been plotted in the same figure, assuming that the C2+ part of the gas is not affected by any segregation when the methane portion suffers a chemical and isotopic fractionation in accordance with the experiments described in Pernaton et al. (1996). The trend is mainly controlled by the V2 vector with a positive slope, with V2 being positively correlated with the importance of migration. This consistency of both the statistics and the definition of maturity and segregative processes in gas history urges us to test this new approach for interpreting geochemical gas data on some concrete examples.
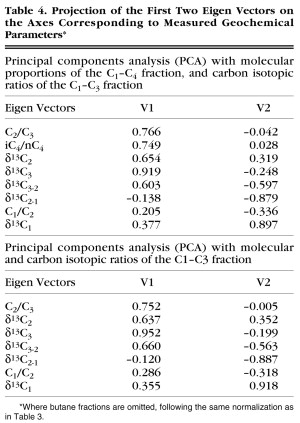
Considering that in some gas databases, the information on the two isomers of butane may be missing either their isotopic values or their molecular proportions, we also calculated the first two Eigen vectors of our database without the butane isotopic constraint (Table 4), and without both the proportions and the isotopic ratios of butane (Table 4). The results show the same tendency as with the whole C1-C4 database, and the values presented in Table 4 may be interpreted in the same way.
GEOLOGICAL EXAMPLES: THE LINK AMONG PHYSICS, STATISTICS, AND GEOLOGY
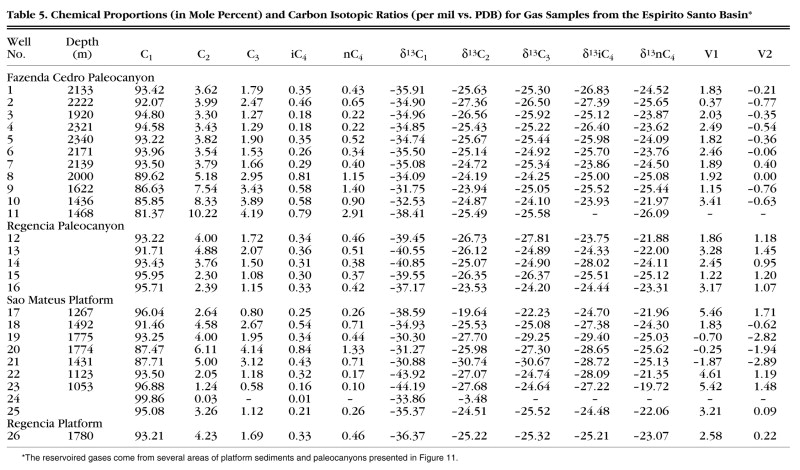
In two geological well-constrained examples, we show how geochemical gas data representations give new information about the overall gas history of a basin (maturation and migration). The first example is a portion of the Espirito Santo basin in Brazil. The stratigraphic and tectonic style of this basin reflects the evolution of a mature, passive, rifted continental margin of the south Atlantic Ocean (Estrella et al., 1984). Basically, the Cretaceous marine stage is characterized by Albian-Cenomanian platform sediments consisting of layers of sandstones and shales and eroded in several places by large paleocanyons that were filled by Upper Cretaceous turbidites (Trindade, 1987). The source rock is mainly present in the lacustrine shales of the rift phase. Hydrocarbon fields occur in both platform and turbidites sediments (Figure 11). It is possible to distinguish two contrasting behaviors between these two geological settings for the reservoirs with the Gastar diagram and with the PCA (Table 5). Figure 12 shows two Gastar diagrams in turbidites and platform sediments, respectively, with three different fields in each location. Figure 13 represents the entire range of analyzed gases in these areas on the V1-V2 PCA diagram. Only the turbidite fields (paleocanyons 1 and 2) exhibit a gradient of maturity with negligible migration effect, whereas the platform fields show both maturity and migration fractionations. This can be seen from the Gastar diagrams, where a strong unconformity is seen between the left and the right parts of the diagram for the platform fields because the fingerprints of the turbidite fields are much more regular on the left side. This is geologically in agreement with the fact that the hydrocarbon kitchens for the turbidite sediments are proposed to be close to the disconformity between the source rocks and the paleocanyon with a very short distance of migration (Figure 14a) and with small barriers of permeabilities (the turbidites allowing gas transport mainly in a homogeneous Darcean flux). Indeed, Estrella et al. (1984) characterized the rift hydrocarbon pods just below the paleocanyons in such a way that the source beds are in direct contact through the walls of the canyons with the turbidite reservoirs. The widespread, coalescent turbidite bodies acted as hydrocarbon collectors in the bottom of the canyons, allowing updip short secondary migration to occur (Figure 14a). The hydrocarbon kitchen for the platform fields, however, is more remote in the eastern part of the basin in the offshore area (Figure 14b). It is assumed that the gases have had to cross a greater amount of low-porosity rocks before filling the reservoirs. It is also worth mentioning that a direction of migration may be deduced from this approach from the degree of fractionation of the parameters involving methane and from the V2 values (Figures 12b, 14b). In the platform fields of the Espirito Santo basin, the determined direction is perfectly coherent with the knowledge of geology and oils geochemistry, indicating an east-west gas migration from the deepest parts of the margin to the onshore platform, where the gases were sampled (Figure 14b). Estrella et al. (1984) also suggested a long-distance migration, when the hydrocarbon pods lie deeper eastward in the offshore part of the basin. Thus, lateral updip long-distance migration occurs through the excellent SÒo Mateus sandstone carrier beds sealed by the Rio Itaunas evaporitic beds. The accumulations were controlled by structural closure occurring at the same stratigraphic level (Figure 14b). This self-consistency between gas parameters and clear geological observations reinforces the fact that the gas signatures may give valuable information on the directions of migration and on the distance of migration for a given sedimentological framework. The gas information as a tracer thus becomes a powerful tool in basin modeling, providing from this interpretation a consistent geometrical control for studies about maturity and migration paths.
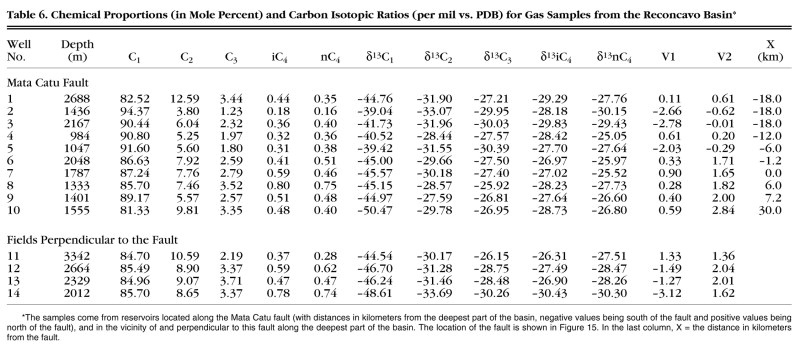
The other example presented is the Recncavo basin in Brazil (Figure 15), and is part of an intracontinental north-south aborted rift basin immediately preceding the opening of the Atlantic ocean (Figueiredo et al., 1994). Samples were collected solely from reservoirs in the vicinity of the Mata Catu fault, a major northwest-southeast fault system, crosscutting the whole basin (Figueiredo et al., 1994). Several hydrocarbon fields are located just along the fault, whereas other fields are set on a perpendicular line centered in the deepest part of the basin close to the hydrocarbon kitchens (Table 6). The data are presented on Figures 16 and 17 for the Gastar diagrams and PCA, respectively, with a distinction for the gases collected along the fault and the gases collected in a transept perpendicular to the fault. Gases located at the apex of the maximum of maturity of the source rocks and perpendicular to the Mata Catu fault do not show any fractionation due to migration but do show a clear maturity gradient. On the contrary, gases along the fault show an important trend of segregative migration with a consistent evolution with regard to their position along the fault. Figure 18 presents the values of the V2 Eigen vector vs. an approximate distance measured along the fault and expressed in kilometers. The zero distance corresponds to the deepest section of the basin along the fault. There is an excellent trend vs. the geometric positions of the wells, indicating a long-distance migration from the southeast portion of the fault (where the kitchen is located) through the northeast area. This reinforces the idea about the absence of any other kitchen in the northwestern area. We have also determined that no correlation is observed between this V2 parameter and the reservoir depth, demonstrating that bacterial contamination cannot be responsible for the variation of the V2 parameter (mainly controlled by the carbon isotopic signature of methane). If there were some bacterial contamination, it would appear in shallower gas pools. This is the first time that a fault may be seen as a segregative drain by looking at the geochemical signatures of the gases. Major fault systems may play an important role for hydrocarbon migrations and may be monitored using this type of geochemical study.
The use of all the available geochemical data associated with some experimental controls on the processes affecting the chemical and isotopic signatures of hydrocarbon gases improves the usefulness of these gases in hydrocarbon exploration. Using diagrams based on experimental work and statistical data analyses, we have shown for two Brazilian basins that it is possible to reconstruct the hydrocarbon pathways, directions of migrations, and degree of maturity of the source rocks associated with the gas. In the Espirito Santo basin, the gas pools located in paleocanyons can be interpreted as practically autochthonous, whereas the gases in the rift platform sediments exhibit a longer migration from a kitchen located offshore. In the Reconcavo basin, a major tectonic occurrence, the Mata Cata fault, plays a major role in hydrocarbon migration and accumulations in the southern part of the basin. This gives a new and important control for petroleum systems evaluation.
Arneth, J. D., and U. Matzigkeit, 1985, Variations in the carbon isotopic composition and production yield of various pyrolysis products under open and closed system conditions: Organic Geochemistry, v. 10, p. 1067-1071.
Barker, J. F., and S. J. Pollock, 1984, The geochemistry and origin of natural gases in southern Ontario: Bulletin of Canadian Petroleum Geology, v. 32, no. 3, p. 313-326.
Behar, F., S. Kressmann, J. L. Rudkiewicz, and M. Vandenbroucke, 1992, Experimental simulation in a confined system and kinetic modelling of kerogen and oil cracking: Organic Geochemistry, v. 19, no. 1-3, p. 173-189.
Berner, U., E. Faber, and W. Stahl, 1992, Mathematical simulation of the carbon isotopic fractionation between huminitic coals and related methane: Chemical Geology (Isotope Geoscience Section), v. 94, p. 315-319.
Berner, U., E. Faber., G. Scheeder, and D. Panten, 1995, Primary cracking of algal and landplant kerogens: kinetic models of isotope variations in methane, ethane and propane: Chemical Geology, v. 126, no. 3-4, p. 233-246.
Bondar, A. D., 1987, Role of diffusion in differentiation of carbon isotopes of methane of the Earth's crust (in Russian): Geokhimiya, v. 9, p. 1274-1283.
Chung, H. M., and W. M. Sackett, 1979, Use of stable carbon isotope compositions of pyrolytically derived methane as maturity indices for carbonaceous material: Geochimica et Cosmochimica Acta, v. 43, p. 1979-1988.
Chung, H. M., J. R. Gormly, and R. M. Squires, 1988, Origin of gaseous hydrocarbons in subsurface environment: theoretical considerations of carbon isotope distribution: Chemical Geology, v. 71, p. 97-103.
Clayton, C., 1991, Carbon isotope fractionation during natural gas generation from kerogen: Marine and Petroleum Geology, v. 8, p. 232-240.
Colombo, U., F. Gazzarrini, G. Sironi, R. Gonfiantini, and E. Tongiorgi, 1965, Carbon isotope composition of individual hydrocarbons from Italian natural gases: Nature, v. 205, p. 1303-1304.
Colombo, U., F. Gazzarrini, R. Gonfiantini, G. Sironi, and E. Tongiorgi, 1966, Measurement of C13/C12 isotope ratios on Italian natural gases and their geochemical interpretation, in P. A. Schenck and I. Havenaar, eds., Advances in organic geochemistry, 1964: Oxford, Pergamon, p. 279-292.
Colombo, U., F. Gazzarrini, R. Gonfiantini, G. Kneuper, M. Teichm³ller, and R. Teichm³ller, 1970, Carbon isotope study on methane from German coal deposits, in G. D. Hobson and G. C. Speers, eds., Advances in organic geochemistry, 1966: Oxford, Pergamon, p. 1-26.
Debart L., A. Morineau, and K. M. Warwick, 1984, Multivariate descriptive statistical analysis: correspondence analysis and related techniques for large matrices: New York, Wiley, 231 p.
Estrella, G., M. Rocha Mello, P. C. Gaglianone, R. L. M. Azevedo, K. Tsubone, E. Rossetti, J. Concha, and I. M. R. A. Bruning, 1984, The Espirito Santo basin (Brazil): source rock characterization and petroleum habitat, in G. Demaison and R. J. Murris, eds., Petroleum Geochemistry and Basin Evolution: AAPG Memoir 35, p. 253-271.
Faber, E., 1987, Zur Isotopengeochemie gasf÷rmiger Kohlenwasserstoffe: Erdol, Erdgas, Kohle, v. 103, no. 5, p. 210-218.
Faber, E., W. J. Stahl, and M. J Whiticar, 1992, Distinction of bacterial and thermogenic hydrocarbon gases, in R. Vially, ed., Bacterial gas: Paris, Editions Technip, p. 63-74.
Figueiredo, A. M. F., J. A. E. Braga, H. M. C. Zabalaga, J. J. Oliveira, G. A. Aguiar, O. B. Silva, L. F. Mato, L. M. F. Daniel, L. P. Magnavita, and C. H. L. Bruhn, 1994, Reconcavo basin, Brazil: a prolific intracontinental rift basin, in S. M. Landon, ed., Interior rift basins: AAPG Memoir 59, p. 157-203.
Franck, D. J., J. O. Smith, and W. M. Sackett, 1974, Reevaluation of carbon-isotope compositions of natural methanes: AAPG Bulletin, v. 58, p. 2319-2325.
Friedrich, H. U., and H. Juntgen, 1972, Some measurements of the 12C/13C ratio in methane or ethane desorbed from hard coal or released by pyrolysis, in H. R. Gaertner and H. Wehner, eds., Advances in organic geochemistry, 1971: Oxford, Pergamon, p. 639-646.
Fuex, A. N, 1980, Experimental evidence against an appreciable isotopic fractionation of methane during migration, in A. G. Douglas and J. R. Maxwell, eds., Advances in organic geochemistry, 1979: Oxford, Pergamon, p. 725-732.
Galimov, E. M., 1975, Carbon isotopes in oil-gas geology: NASA technical translation NASA TT F-682, 395 p.
Galimov, E. M., 1988, Sources and mechanisms of formation of gaseous hydrocarbons in sedimentary rocks, in M. Schoell, ed., Origins of methane in the Earth: Chemical Geology (special issue), v. 71, p. 77-95.
Hoering, T. C., and H. E. Moore, 1958, The isotopic composition of the nitrogen in natural gases and associated crude oils: Geochimica et Cosmochimica Acta, v. 13, p. 225-232.
James, A. T., 1983, Correlation of natural gas by use of carbon isotopic distribution between hydrocarbon components: AAPG Bulletin, v. 67, no. 7, p. 1176-1191.
James, A. T., 1990, Correlation of reservoired gases using the carbon isotopic compositions of wet gas components: AAPG Bulletin, v. 74, no. 9, p. 1441-1458.
Kaufman, R. L., A. S. Ahmed, and R. J. Elsinger, 1990, Gas chromatography as a development and production tool for fingerprinting oils from individual reservoirs: application in the Gulf of Mexico: Gulf Coast Section, SEPM Foundation Ninth Annual Research Conference Proceedings, p. 263-282.
Krooss, B. M., D. Leythauser, and R. G. G. Schaefer, 1992, The quantification of diffusive hydrocarbon losses through cap rocks of natural gas reservoirs--a reevaluation: AAPG Bulletin, v. 76, p. 403-406.
Krooss, B. M., S. Schlomer, R. Gaschnitz, and R. Littke, 1998, Aspects of natural gas generation and migration in sedimentary systems: V. M. Goldschmidt conference 1998: Mineralogical Magazine, v. 62A, p. 818-819.
Lorant, F., A. Prinzhofer, F. Behar, and A. Y. Huc, 1998, Carbon isotopic and molecular constraints on the formation and the expulsion of thermogenic hydrocarbon gases: Chemical Geology, v. 147, p. 249-264.
Magnier, C., and A. Y. Huc, 1995, Pyrolysis of asphaltenes as a tool for reservoir geochemistry: Organic Geochemistry, v. 23, no. 10, p. 963-967.
Mattavelli, L., T. Ricchiuto, D. Grignani, and M. Schoell, 1983, Geochemistry and habitat of natural gases in Po basin, northern Italy: AAPG Bulletin, v. 67, p. 2239-2254.
Neglia, S., 1979, Migration of fluids in sedimentary basins: AAPG Bulletin, v. 63, p. 573-297.
Nelson, J., and E. C. Simmons, 1992, The quantification of diffusive hydrocarbon losses through cap rocks of natural gas reservoirs--a reevaluation: discussion: AAPG Bulletin, v. 76, p. 1839-1841.
Nelson, J., and E. C. Simmons, 1995, Diffusion of methane and ethane through the reservoir cap rock: implication for the timing and duration of catagenesis: AAPG Bulletin, v. 79, p. 1064-1074.
Pernaton, E., A. Prinzhofer, and F. Schneider, 1996, Reconsideration of methane signature as a criterion for the genesis of natural gas: influence of migration on isotopic signature: Revue de l'Institut Francais du Petrol, v. 51, no. 5, p. 635-651.
Prinzhofer, A., and A. Y. Huc, 1995, Genetic and post-genetic molecular and isotopic fractionations in natural gases: Chemical Geology, v. 126, no. 3-4, p. 281-290.
Prinzhofer, A., and F. Lorant, 1997, Ethane/propane diagram for gas genesis characterization: 18th International Meeting European Association of Organic Chemistry, Proceedings, p. 567-568.
Prinzhofer, A., and E. Pernaton, 1997, Isotopically light methane in natural gas: bacterial imprint or segregative migration?: Chemical Geology, v. 142, p. 193-200.
Prinzhofer, A., P. Lopez, and J. L. Oudin, 1995, Geological and geochemical evidence of leakage from a gas reservoir through an argillaceous cap rock (extended abs.): European Association of Organic Geochemistry '95, San Sebastian, Spain, p. 293-295.
Reitsema, R. H., A. J. Kaltenvack, and F. A. Lindberg, 1981, Source and migration of light hydrocarbons indicated by carbon isotopic ratios: AAPG Bulletin, v. 65, p. 1536-1542.
Ricchiuto, T., and M. Schoell, 1988, Origin of natural gases in the Apulian basin in south Italy: a case history of mixing of gases of deep and shallow origin, in L. Mattavelli and L. Novelli, eds., Advances in Organic Geochemistry, 1987: Organic Geochemistry, v. 13, p. 311-318.
Rooney, M. A., G. E. Claypool, and G. E. Chung, 1995,
Modeling thermogenic gas generation using carbon isotope ratios of natural gas
hydrocarbons: Chemical Geology, v. 126, no. 3-4,
p. 219-232.
Schneider, F., A. Prinzhofer, P. Lopez, J. L. Oudin, and E. Pernaton, 1995, Would it be realistic to neglect gas diffusion in water as a migration process? (extended abs.): European Association of Petroleum Geology, abstract no. F037, unpaginated.
Schoell, M., 1980, The hydrogen and carbon isotopic composition of methane from natural gases of various origins: Geochimica et Cosmochimica Acta, v. 44, p. 649-661.
Schoell, M., 1983, Genetic characterization of natural gases: AAPG Bulletin, v. 67, no. 12, p. 2225-2238.
Stahl, W. J., 1977, Carbon and nitrogen isotopes in hydrocarbon research and exploration: Chemical Geology, v. 20, p. 121-149.
Stahl, W. J., and B. D. Carey, 1975, Source-rock identification by isotope analyses of natural gases from fields in the Val Verde and Delaware basins, west Texas: Chemical Geology, v. 16, p. 257-267.
Syngayevsky, Y. D., V. S. Lebedev, T. P. Safronova, and A. V. Sushilin, 1978, Study of fractionation of carbon isotopes during migration of hydrocarbons in the gas phase through rocks: Geologiya Nefti i Gaza, v. 1, p. 53-59.
Trindade, L. A. F, 1987, Classificacao e alteracao de oleos na bacia terrestre do Espirito Santo: Geochemica Brasiliensis, v. 1, p. 71-88.
Alain Prinzhofer graduated with a Ph.D. in geology from the School of Mines of Paris. He completed a second Ph.D. on trace elements and isotopes of mantle rocks at Paris University in 1987. He worked in cosmochemistry at the Californian Institute of Technology and joined the French Institute of Petroleum (IFP) in 1990, where he initiated a group on the geochemistry of natural gases. He presently works from laboratory experiments to geological case studies.
Marcio Rocha Mello received a degree in geology from Brasilia University. In 1976, he joined Petrobras as a well-site geologist working in the Rec¶ncavo basin, located in northeastern Brazil. By 1982, after work as a petroleum explorationist in the Cearß and Potiguar basins, northeastern Brazil, he became the head of the Petrobras Geochemistry Laboratory. In 1985, he joined Bristol University in England, where he received a Ph.D. in petroleum geochemistry. In 1988, he was made head of the Petrobras Geochemistry Section. Presently, he is the head of the Center of Excellence in Geochemistry of Petrobras. In the last 10 years, Marcio has been using the petroleum system approach in most Latin American sedimentary basins. In addition, Marcio is the president of the Brazilian Association of Petroleum Geologists, a recipient of AAPG's Distinguished Achievement Award, and an associated professor at several Brazilian universities.
Tikae Takaki graduated with an M.S. degree in sciences from the Chemical Engineering Department of the Polytechnical School in Sao Paulo, Brazil. She completed her thesis studying oxygen and hydrogen isotope ratios in rain samples in 1978. She worked at the IEN (Institute of Energy Research) in Sao Paulo in 1978 and joined CENPES, the Research Center of Petrobras, in 1979 in the Center of Excellence in Geochemistry, where she currently manages the isotope section of the laboratories.
We would like to thank Petrobras for the authorization to publish these results. In the field, sampling and useful discussions were made possible by all the colleagues of Petrobras-Salvador and Petrobras-Sao Mateus, and in particular Fernando Taboada Fontes and Roberto d'Avila. Gilberto Pereira da Silva did a lot for the best and most efficient gas sampling. We would like also to thank Caroline Sulzer for performing all the chemical and isotopic analyses, and Caroline Magnier and Elvyn Marshall for careful editing. John Curtis, Moses Chung, and Martin Schoell made critical reviews that improved the logic and the presentation of this paper.