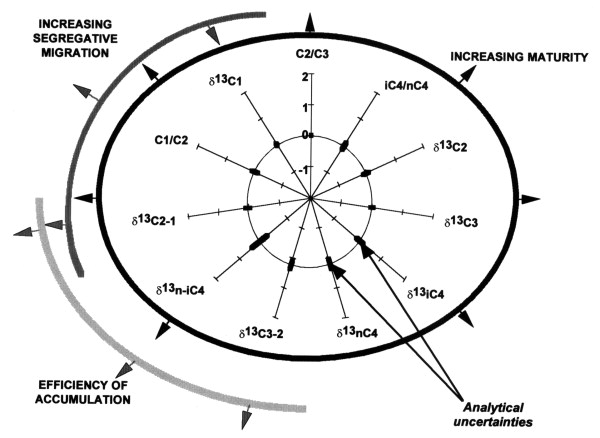
Figure 6--Principle of the Gastar diagram with error bars, including the three main processes (maturity, segregative migration, efficiency of accumulation), their direction of variations, and how each affects the 11 normalized geochemical parameters. Because of the normalization through averaged values and standard deviations, Gastar diagram axes have the same scales.