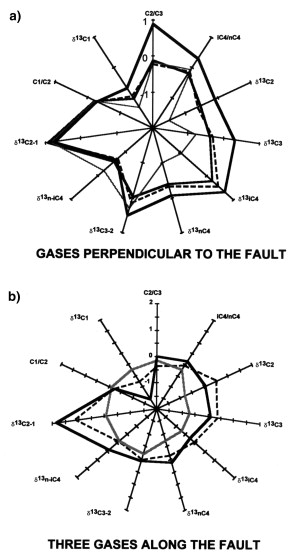
Figure 16--Gastar diagram for data from the Recôncavo basin. (a) Gases located in fields in a transection perpendicular to the Mata Catu fault with no evidence of segregation due to migration and showing only maturity gradient. (b) Gases located along the Mata Catu fault with a clear scatter between maturity parameters (right part of the diagram) and migration parameters (left part of the diagram). The scales are the same for all 11 axes of each Gastar diagram.