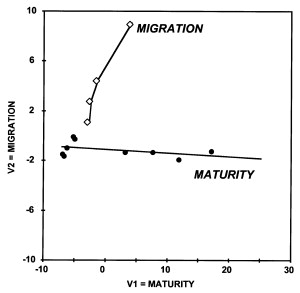
Figure 10--Experimental data represented in a V1-V2 diagram. The experimental circles come from dry confined system pyrolyses of the type II Mesnil sur Vair kerogen having various times and temperature ranges. Diamonds correspond to gases having migrated in saturated shales, considering that relative proportions and isotopic ratios of propane and of the two butane isomers are not modified by the process (Pernaton et al., 1996). The two main Eigen vectors, V1 and V2, may be assimilated to maturity trends and segregative trends, respectively.