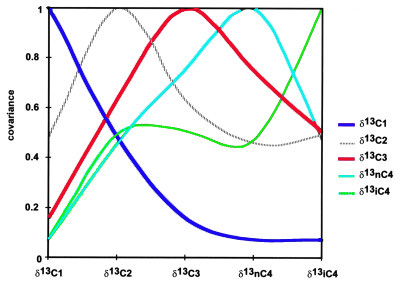
Figure 9--Plot of the covariances between the d13C of the five gas hydrocarbons taken in consideration (C1, C2, C3, iC4, and nC4) from our complete gas database. When the covariances between the C2+ molecules are between 0.5 and 1, methane isotopic values are very poorly correlated with the C2+ values. This poor correlation shows the risk in using only the carbon isotopic ratio of methane to characterize the gas history.