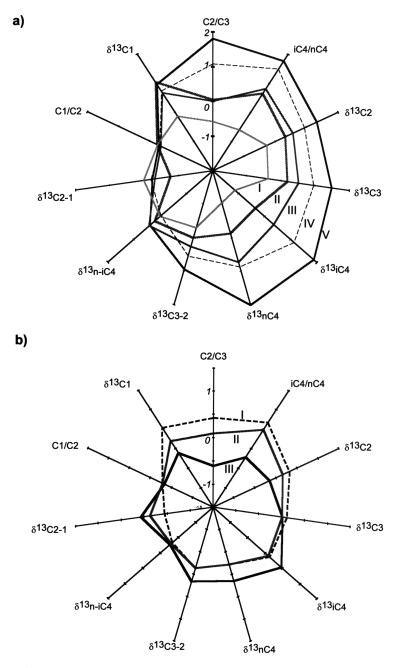
Figure 7--Two examples of normalized Gastar diagrams for two series of gases coming from two different fields. (a) A regular increase of maturity can be seen from gas I to gas V. (b) The influence of a more confined generation can be seen from gas I to gas III on the positions of the diagrams. The scales are the same for all 11 axes of each Gastar diagram.