Conclusions
This
report presents a review of the U.S. Geological Survey (USGS)
2007 assessment of the undiscovered conventional oil and gas
resources in Midway-Wilcox-Carrizo Sand strata (Paleocene-Eocene)
underlying the U.S. Gulf of Mexico Coastal Plain and State
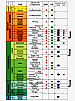
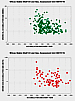
waters. Numerical results of the assessment are presented in
Figure 20
and in Dubiel et al. (2007) and Warwick et al. (2007b).
For purposes of the assessment, an Upper Jurassic-Cretaceous-Tertiary
total petroleum system (TPS) was defined for the Gulf of Mexico
basin (Figure
6). Five assessment units (AUs) were defined for the
Midway (Paleocene) and Wilcox (Paleocene-Eocene) Groups, and
the Carrizo Sand of the Claiborne Group (Eocene) interval:
(1) the Wilcox Stable Shelf Oil and Gas AU; (2) the Wilcox
Expanded Fault Zone Gas and Oil AU; the (3) Wilcox Slope and
Basin Floor Gas AU; (4) the Wilcox-Lobo Slide Block Gas AU;
and (5) the Wilcox Mississippi Embayment AU (not quantitatively
assessed) (Figure
12).
A generalized structural and stratigraphic
model for Paleogene strata was developed to help define a generic
updip, stable shelf AU; a middip, expansion (extension) zone
AU; and a downdip, slope and basin floor AU for each assessed
stratigraphic interval (Figure
8). A significant controlling factor for the location
of the middip expansion zone AU is the location of underlying,
stratigraphically older shelf margins. Using this geology-based
assessment methodology, the USGS estimated a mean of 36.9 trillion
cubic feet of undiscovered natural gas, a mean of 110 million
barrels of undiscovered oil, and a mean of 639 million barrels
of undiscovered natural gas liquids in onshore lands and State
waters of the Gulf Coast.
Acknowledgments
The author wishes to thank all members of
the U.S. Geological Survey Gulf Coast Tertiary assessment team
for their contributions to this paper. In addition, discussions
with staff members of the Minerals Management Service Gulf
of Mexico Region, Mississippi Department of Environmental Quality
Office of Geology, Louisiana Geological Survey, and The University
of Texas at Austin Bureau of Economic Geology greatly contributed
to the concepts presented in this paper.
As
noted above, this report contains the abstract, figures, and
references presented April 22, 2008, in a poster session at
the AAPG Annual Convention in San Antonio, Texas. No attempt
has been made herein to provide other than the bare minimum
of text to support each of the figures as presented at the
AAPG Meeting. This same material currently is in manuscript
format in internal peer review at the U.S. Geological Survey,
where it will ultimately be presented in a formal-series publication.
Readers of the current presentation are encouraged to contact
the author via email with their questions and comments.
References
Barker,
C.E., L.R.H. Biewick, P.D. Warwick, and J.R. SanFilipo, 2000,
Preliminary Gulf Coast coalbed methane exploration maps - depth
to Wilcox, apparent Wilcox thickness and vitrinite reflectance:
U.S. Geological Survey Open File Report 00-113, 2 sheets.
Charpentier,
R.R., and T.S. Ahlbrandt, 2003, Petroleum (oil and gas) geology
and resources, in De Vivo, Benedetto, Grasemann, Bernhard,
and Stüwe, Kurt eds., Geology, Encyclopedia of Life Support
Systems (EOLSS), Developed under the Auspices of the UNESCO,
EOLSS Publishers, Oxford, UK, v. 5, p. 31-53: http://www.eolss.net
(accessed March 19, 2009).
Charpentier,
R.R., and T.R. Klett, 2005, A Monte Carlo simulation method
for the assessment of undiscovered, conventional oil and gas, in USGS
Southwestern Wyoming Province Assessment Team, compilers, Petroleum
systems and geologic assessment of oil and gas in the southwestern
Wyoming province, Wyoming, Colorado and Utah: U.S. Geological
Survey Digital Data Series DDS-69-D, chapter 21, 5 p., CD-ROM: http://certmapper.cr.usgs.gov/data/noga00/natl/text/CH_21.pdf
(accessed March 19, 2009).
Condon,
S.M., and T.S. Dyman, 2006, 2003 geologic assessment of undiscovered
conventional oil and gas resources in the Upper Cretaceous
Navarro and Taylor Groups, Western Gulf Province, Texas: U.S.
Geological Survey Digital Data Series DDS-69-H, Chapter 2,
42 p., CD-ROM: http://pubs.usgs.gov/dds/dds-069/dds-069-h/
(accessed March 19, 2009).
Cook,
Troy, 2005, Calculation of estimated ultimate recovery (EUR)
for wells in continuous-type oil and gas accumulations, in USGS
Southwestern Wyoming Province Assessment Team, compilers, Petroleum
systems and geologic assessment of oil and gas in the southwestern
Wyoming province, Wyoming, Colorado and Utah: U.S. Geological
Survey Digital Data Series DDS-69-D, chapter 23, 6 p., CD-ROM:
http://pubs.usgs.gov/dds/dds-069/dds-069-d/REPORTS/69_D_CH_23.pdf
(accessed March 19, 2009).
Crovelli,
R.A., 2005, Analytic resource assessment method for continuous
petroleum accumulations—the ACCESS assessment method, in USGS
Southwestern Wyoming Province Assessment Team, compilers, Petroleum
systems and geologic assessment of oil and gas in the southwestern
Wyoming province, Wyoming, Colorado and Utah: U.S. Geological
Survey Digital Data Series DDS-69-D, chapter 22, 10 p., CD-ROM:
http://pubs.usgs.gov/dds/dds-069/dds-069-d/REPORTS/69_D_CH_22.pdf
(accessed March 19, 2009).
Dubiel
R.F., J.K. Pitman, O.N. Pearson, S.M. Condon, P.D. Warwick,
A.W. Karlsen, J.L. Coleman, P.C. Hackley, D.O. Hayba, S.M.
Swanson, R.R. Charpentier, T.A. Cook, T.R. Klett, R.M Pollastro,
and C.J. Schenk, 2007, Assessment of undiscovered oil and gas
resources in Tertiary strata and Cretaceous-Tertiary coalbed
gas of the Gulf Coast: U.S. Geological Survey Fact Sheet FS-2007-3066,
4 p.: http://pubs.usgs.gov/fs/2007/3066/
(accessed March19, 2009).
Eguiluz
de Antuñano, S., 2001, Geologic evolution and gas resources
of the Sabinas Basin in northeastern Mexico, in C. Bartolini,
R.T. Buffler, and A. Cantú-Chapa, eds., The western Gulf of
Mexico Basin: Tectonics, sedimentary basins, and petroleum
systems: AAPG Memoir 75, p. 241-270.
Ewing,
T.E., 1991a, Structural framework, in A. Salvador, ed.,
The Gulf of Mexico Basin: GSA, The Geology of North America,
v. J, p. 31-52.
Ewing,
T.E., 1991b, The tectonic framework of Texas - text to accompany
The tectonic map of Texas: The University of Texas at Austin
Bureau of Economic Geology, Publication SM0001, 36 p.
Ewing,
T.E., and R.F. Lopez, 1991, Principal structural features,
Gulf of Mexico basin, in A. Salvador, ed., The Gulf
of Mexico Basin: The Geological Society of America, The Geology
of North America, v. J, plate 2, 1 sheet.
French,
C.D., and C.J. Schenk, 2004, Map showing geology, oil and gas
fields, and geologic provinces of the Caribbean Region: U.S.
Geological Survey Open-File Report 97-470-K, 1 sheet, CD-ROM:
http://pubs.usgs.gov/of/1997/ofr-97-470/OF97-470K/
(accessed March 19, 2009).
French,
C.D., and C.J. Schenk, 2005, Map showing the geology, oil and
gas fields, and geologic provinces of the Gulf of Mexico Region:
U.S. Geological Survey Open-File Report 97-470-L, 1 sheet,
CD-ROM:
http://pubs.usgs.gov/of/1997/ofr-97-470/OF97-470L/
(accessed March 19, 2009).
Frezon,
S.E., T.M. Finn (comp.), and K.L. Varnes (ed.), 1988, Map of
sedimentary basins in the conterminous United States: U.S.
Geological Survey Oil and Gas Investigation Map OM-223, 1 sheet,
scale: 1:5,000,000.
Hood,
K.C., L.M. Wenger, O.P. Gross, and S.C. Harrison, 2002, Hydrocarbon
systems analysis of the northern gulf of Mexico - delineation
of hydrocarbon migration pathways using seeps and seismic imaging, in D.
Schumacher and L.A. LeSchack, eds., Applications of geochemistry,
magnetics, and remote sensing: AAPG Studies in Geology no.
48 and SEG Geophysical Reference Series no. 11, p. 25-40.
Humble
Geochemical Services, Geochemical and Environmental Research
Group, BEICIP, Inc, Brame Geosciences, 2002, Petroleum systems
of the Gulf of Mexico - prediction of hydrocarbon charge, GOM
source rock and oil asphaltene kinetics in Temispack 2D basin
modeling, Proposal 2002, 16 p.: http://www.humble-inc.com/gom2001.htm
(accessed March 19, 2009).
IHS
Energy Group, 2005 [includes data current as of December, 2005],
PI/Dwights Plus US Well Data: Englewood, CO, IHS Energy Group;
database available from IHS Energy Group, 15 Inverness Way
East, D205, Englewood, CO 80112, U.S.A.
James,
K.H., 2004, A simple synthesis of Caribbean geology: AAPG Search
and Discovery, Article no. 30026, 5 p.: http://www.searchanddiscovery.com/documents/2004/james/index.htm
(accessed March 19, 2009).
Klett,
T.R., and J.W. Schmoker, 2005, U.S. Geological Survey input-data
form and operational procedure for the assessment of continuous
petroleum accumulations, 2002, in USGS Southwestern
Wyoming Province Assessment Team, compilers, Petroleum systems
and geologic assessment of oil and gas in the southwestern
Wyoming province, Wyoming, Colorado and Utah: U.S. Geological
Survey Digital Data Series DDS-69-D, chapter 18, 8 p., CD-ROM: http://certmapper.cr.usgs.gov/data/noga00/natl/text/CH_18.pdf
(accessed March 19, 2009).
Klett,
T.R., J.W. Schmoker, and R.R. Charpentier, 2005, U.S. Geological
Survey input-data form and operational procedure for the assessment
of conventional petroleum accumulations, in USGS Southwestern
Wyoming Province Assessment Team, compilers, Petroleum systems
and geologic assessment of oil and gas in the southwestern
Wyoming province, Wyoming, Colorado and Utah: U.S. Geological
Survey Digital Data Series DDS-69-D, chapter 20, 7 p., CD-ROM: http://certmapper.cr.usgs.gov/data/noga00/natl/text/CH_20.pdf
(accessed March 19, 2009).
Lüders,
V., B. Horsfield, T. Kenkmann, B. Mingram, and A.Wittmann,
2003, Hydrocarbons and aqueous fluids in Cretaceous sediments
of the ICDP-Chicxulub drill core Yax-1: Lunar and Planetary
Science, v. 34, abstract no.1378, 2 p.: http://www.lpi.usra.edu/meetings/lpsc2003/pdf/1378.pdf
(accessed March 19, 2009).
Nehring,
R., 1991, Oil and gas resources, in A. Salvador, ed.,
The Gulf of Mexico Basin: The Geological Society of America,
The Geology of North America, v. J, p. 445-494.
Nehring
Associates, Inc., 2006 [includes data current as of December
31, 2004], The Significant oil and gas fields of the United
States: Colorado Springs, CO: Nehring Associates, Inc.; database
available from Nehring Associates, Inc., P.O. Box 1655 , Colorado
Springs, CO 80901, U.S.A.
Palmer,
A.R., and J. Geissman, compilers, 1999, 1999 geologic time
scale: GSA product code CTS004, 1 p.: http://www.geosociety.org/science/timescale/timescl.pdf
(accessed March 19, 2009).
Rodriguez,
R., J.R. Sanchez, S. Toucet, and G. Hernandez, 1995, Deep structure
of the southern shelf of Cuba - new implications: AAPG Bulletin,
v. 79, no. 13, p. 82.
Rosenfeld,
J.H., 2003, Economic potential of the Yucatan block of Mexico,
Guatemala, and Belize, in C. Bartolioni, R.T., Buffler,
and J. Blickwede, eds., The Circum-Gulf of Mexico and the Caribbean
- Hydrocarbon habitats, basin formation, and plate tectonics:
AAPG Memoir 79, p. 340-348.
Salvador,
A., 1991, Introduction, in A. Salvador, ed., The Gulf
of Mexico Basin: GSA, The Geology of North America, v. J, p.
1-12.
Salvador,
A., and J.M. Quezada Muneton, 1991, Stratigraphic correlation
chart; Gulf of Mexico Basin, in A. Salvador, ed., The
Gulf of Mexico Basin: GSA, The Geology of North America, v.
J, plate 5, 1 sheet.
Schenk
C.J., T.S. Ahlbrandt, R.R. Charpentier, M.E. Henry, T.R. Klett,
R.M. Pollastro, and J.N. Weaver, 2005, Assessment of undiscovered
oil and gas resources of the north Cuba basin, Cuba, 2004:
U.S. Geological Survey Fact Sheet 2005-3009, 2 p., CD-ROM: http://pubs.usgs.gov/fs/2005/3009/
(accessed March 19, 2009).
Schenk
C.J., D.K. Higley, and L.B. Magoon, 2000, Region 6 assessment
summary - Central and South America, in U.S. Geological
Survey world petroleum assessment 2000 - Description and results:
U.S. Geological Survey Digital Data Series DDS-60, CD-ROM: http://energy.cr.usgs.gov/WEcont/regions/reg6/R6chap.pdf
(accessed March 19, 2009).
Schmoker,
J.W., 2005, U.S. Geological Survey assessment concepts for
continuous petroleum accumulations, in USGS Southwestern
Wyoming Province Assessment Team, compilers, Petroleum systems
and geologic assessment of oil and gas in the southwestern
Wyoming province, Wyoming, Colorado and Utah: U.S. Geological
Survey Digital Data Series DDS-69-D, chapter 13, 7 p., CD-ROM: http://certmapper.cr.usgs.gov/data/noga00/natl/text/CH_13.pdf
(accessed March 19, 2009).
Schmoker,
J.W., and T.R. Klett, 2005, U.S. Geological Survey assessment
concepts for conventional petroleum accumulations, in USGS
Southwestern Wyoming Province Assessment Team, compilers, Petroleum
systems and geologic assessment of oil and gas in the southwestern
Wyoming province, Wyoming, Colorado and Utah: U.S. Geological
Survey Digital Data Series DDS-69-D, chapter 19, 6 p., CD-ROM: http://certmapper.cr.usgs.gov/data/noga00/natl/text/CH_19.pdf
(accessed March 19, 2009).
Scott,
R.J., 2003, The Maverick basin - new technology - new success, in N.C.
Rosen ed., Structure and stratigraphy of south Texas and northeast
Mexico, applications to exploration: SEPM Gulf Coast Section
Foundation, and South Texas Geological Society, Houston, TX,
April 11, 2003, p. 84-121, CD-ROM.
Schruben,
P.G., R.E. Arndt, and W.J. Bawiek, compilers, display software
by A. Russell and R.A. Ambroziak, 1998, Geology of the conterminous
United States at 1:2,500,000 scale - A digital representation
of the 1974 P.B. King and H.M. Beikman Map: U.S. Geological
Survey Digital Data Series DDS-11, Release 2, CD-ROM: http://pubs.usgs.gov/dds/dds11/
(accessed March 19, 2009).
U.S.
Geological Survey National Oil and Gas Resource Assessment
Team, 1995, 1995 National assessment of United States oil and
gas resources: U.S. Geological Survey Circular 1118, 20 p.: http://greenwood.cr.usgs.gov/energy/circ1118.pdf
(accessed March 19, 2009).
USGS
World Energy Assessment Team, 2000, Assessment Summary of the
Pimienta-Tamabra Total Petroleum System 530501 as part of the
2000 World Petroleum Assessment, in U.S. Geological
Survey world petroleum assessment 2000 - Description and results:
U.S. Geological Survey Digital Data Series DDS-60, CD-ROM: http://energy.cr.usgs.gov/WEcont/regions/reg5/P5/tps/t530501.pdf
(accessed March 19, 2009).
Warwick,
P.D., 2006, Thermal maturity of the Wilcox Group (Paleocene-Eocene)
- A key to the Cenozoic petroleum systems of the northern Gulf
of Mexico basin, USA: The Society for Organic Petrology, 23rd
Annual Meeting, Program and Abstracts, Beijing, China, v. 23,
p. 271-272.
Warwick,
P.D., J.L. Coleman, P.C. Hackley, D.O. Hayba, A.W. Karlsen,
E.L. Rowan, and S.M. Swanson, 2007a, USGS assessment of undiscovered
oil and gas resources in Paleogene strata of the U.S. Gulf
of Mexico Coastal Plain and state waters, in Lorcan
Kennan, James Pindell, and N.C. Rosen, eds., The Paleogene
of the Gulf of Mexico and Caribbean Basins - Processes, events,
and petroleum systems: SEPM Gulf Coast Section Foundation 27th
Annual Research Conference, Houston, TX, December 2-5, 2007,
p. 2-44. CD-ROM.
Warwick,
P.D., R.R. Charpentier, T.A. Cook, T.R. Klett, R.M. Pollastro,
and C.J. Schenk, 2007b, Assessment of Undiscovered Oil and
Gas Resources in Cretaceous-Tertiary Coal Beds of the Gulf
Coast Region, 2007: U.S. Geological Survey Fact Sheet FS-3039-07,
2 p.: http://pubs.usgs.gov/fs/2007/3039/
(accessed March 19, 2009).
Warwick,
P.D., J.R. SanFilipo, S.S. Crowley, R.E. Thomas, and J. Fried,
(compilers); J.K. Tully, (digital compiler), 1997, Map showing
outcrop of the coal-bearing units and land use in the Gulf
Coast coal region: U.S. Geological Survey Open File Report
97-72, 1 sheet.
Wenger,
L.M., L.R. Goodoff, O.P Gross, S.C. Harrison, and K.C. Hood,
1994, Northern Gulf of Mexico: An integrated approach to source,
maturation, and migration: in N. Scheidermann, P. Cruz, and
R. Sanchez, eds., Geological Aspects of Petroleum Systems,
Proceedings, 1st Joint American Association of Petroleum Geologists/Asociación
Mexicana de Geólogos Petróleos Research Conference, Mexico
City, Mexico, p. 6.
Return to Top.
|