Click on image to view enlargement.
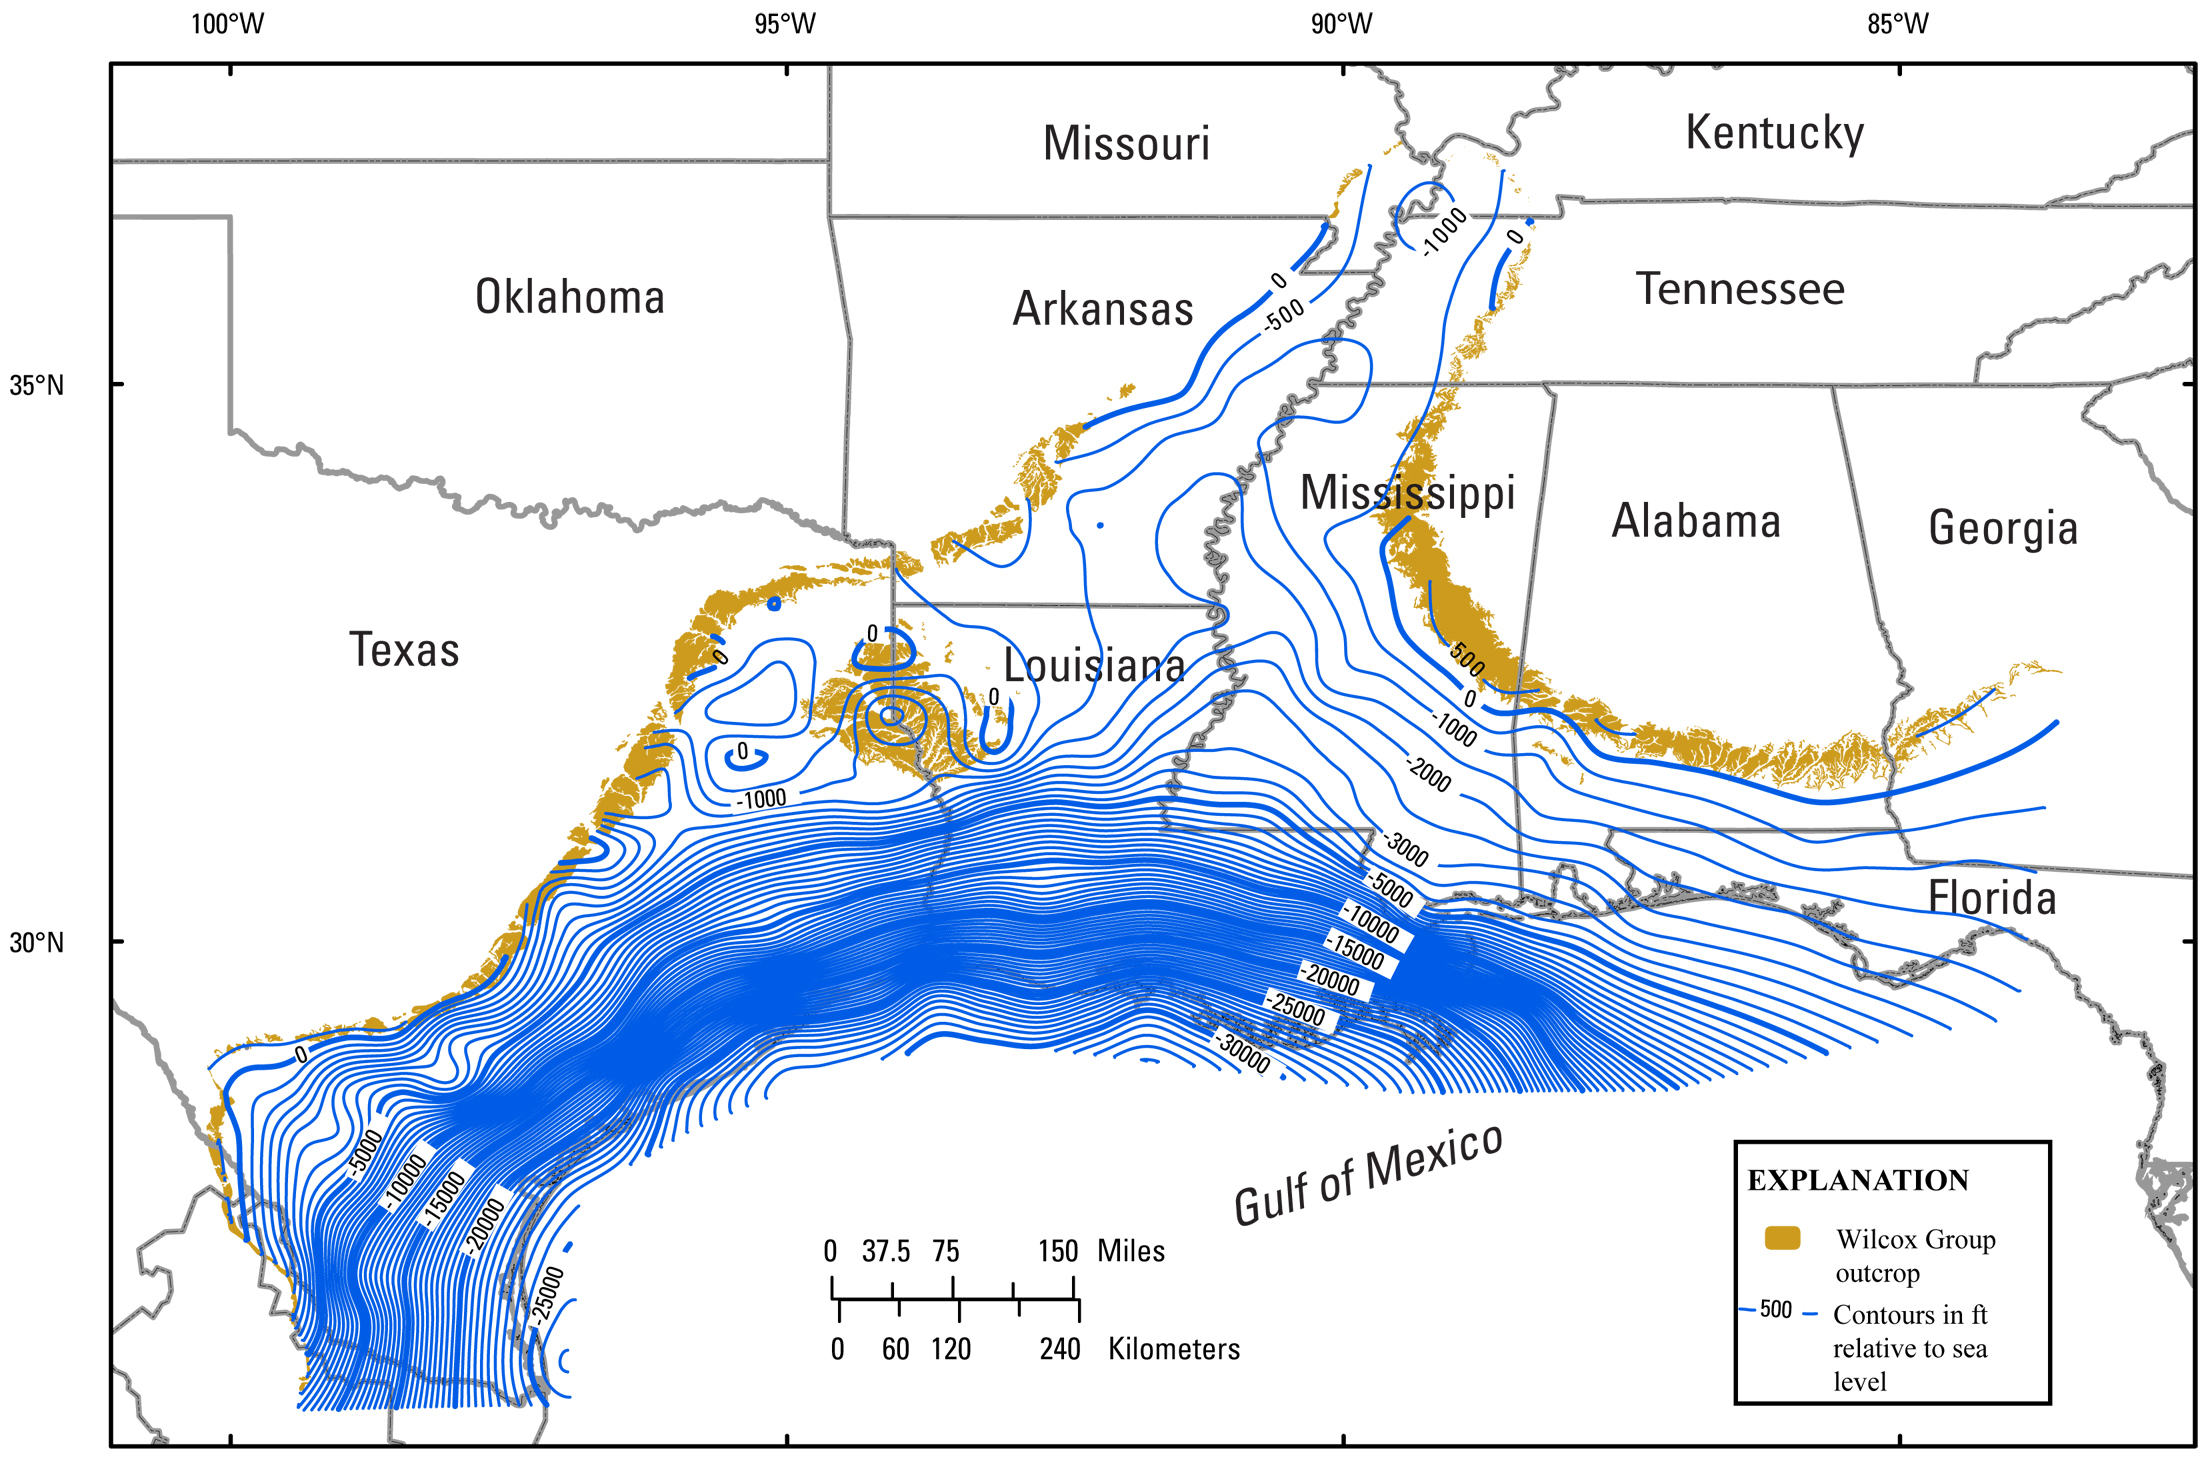
Figure 9. Structure contour map for the top of the Wilcox Group. The map is based on more than 42,000 wells with Wilcox Group top picks in the IHS data base (IHS Energy Group, 2005). Structure contours have been extended to the coastal areas by using control points based on Wilcox top depths from regional cross sections and seismic lines (Ewing, 1991a; Salvador and and Quezada Muneton, 1991). The contours have been smoothed to remove the effect of uplifts associated with salt structures.