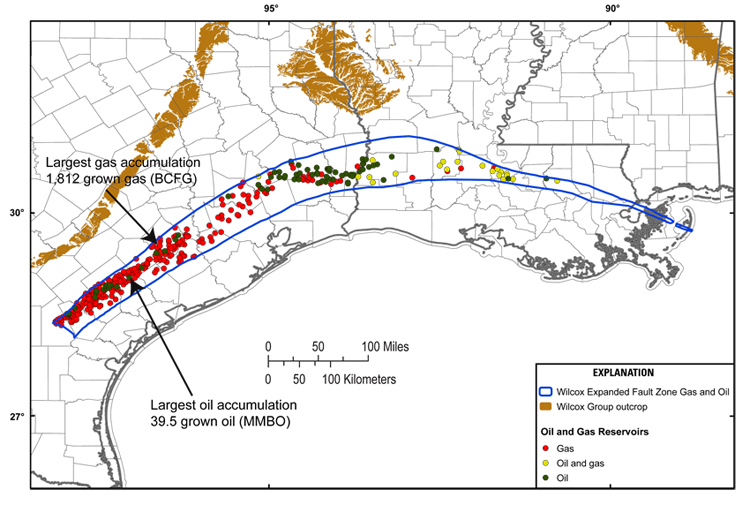
Figure 14. Wilcox Expanded Fault Zone AU, showing oil and gas fields. Largest oil and gas accumulations are shown. Data from Warwick et al. (1997); Nehring Associates, Inc. (2006); Warwick et al. (2007a); and T.R. Klett, USGS, written personal communication (2006).