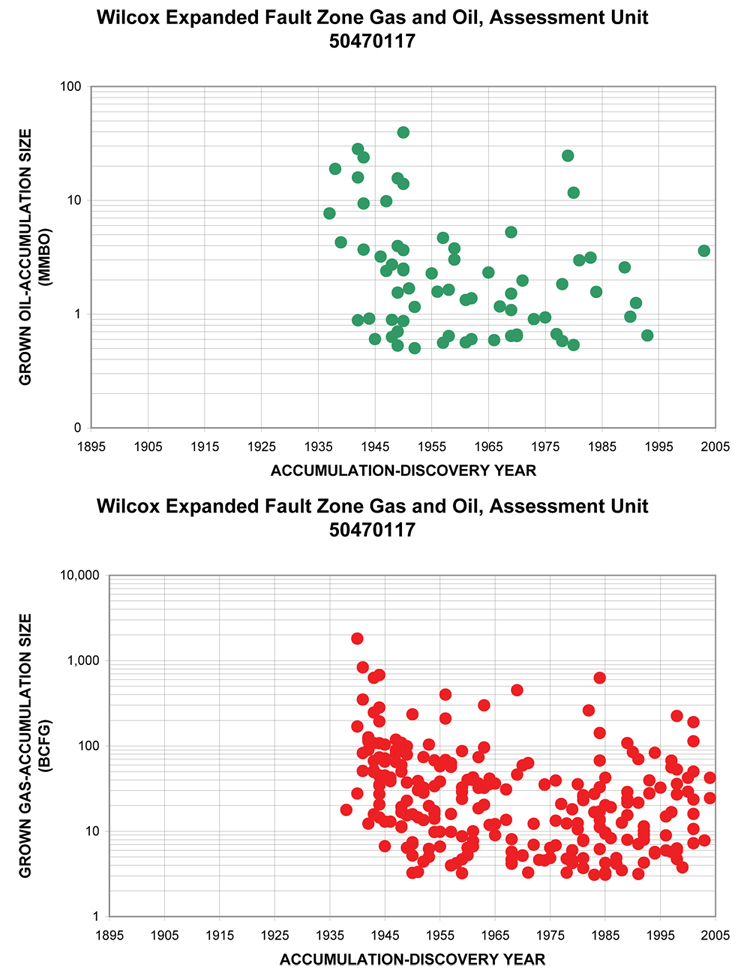
Figure 18. Plots showing size of grown oil and gas accumulations (fields) relative to the discovery year for the Wilcox Expanded Fault Zone Gas and Oil Assessment Unit 50470117. Data from Nehring Associates, Inc. (2006); and T.R. Klett, USGS, written personal communication (2006).