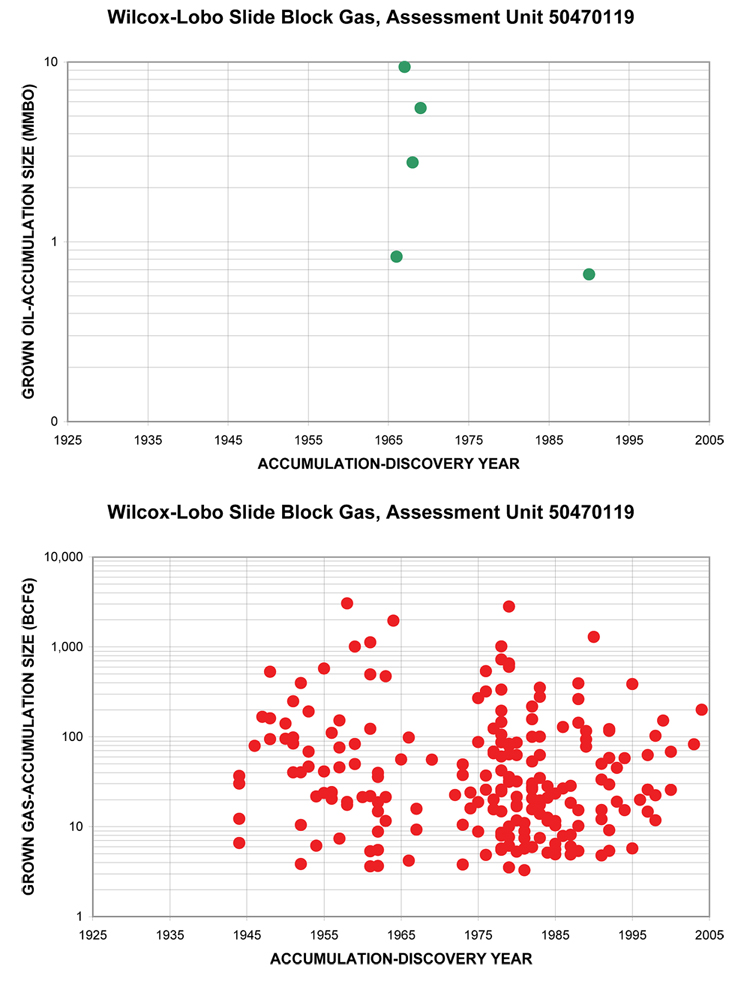
Figure 19. Plots showing size of grown oil and gas accumulations (fields) relative to the discovery year for the Wilcox-Lobo Slide Block Gas Assessment Unit 50470119. Data from Nehring Associates, Inc. (2006); and T.R. Klett, USGS, written personal communication (2006).