Click to view article in PDF format.
Identifying Human Impact on Global Climate from Geologic Data*
Lee C. Gerhard1
Search and Discovery Article #70083 (2010)
Posted October 22, 2010
*Manuscript received September 17, 2010, accepted September 20, 2010.
1Senior Scientist Emeritus, University of Kansas, Lawrence, KS ([email protected])
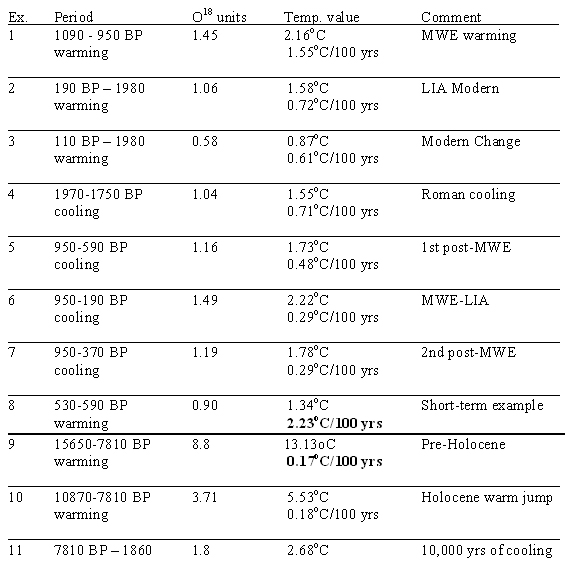
Rates of temperature change in the Holocene geologic record are derived from Oxygen 18/16 ratios measured from the GISP2 ice core. The modern rate of warming of 0.61°C/100 yrs is well within normal Holocene ranges. Over the last 8000 years the global temperature has very gradually dropped 2.3° C. Rates of warming up to 1.55°C/100 years are measured. Rates of cooling appear to be lower than those of warming.
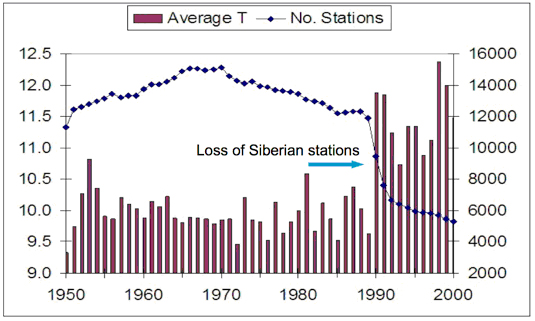
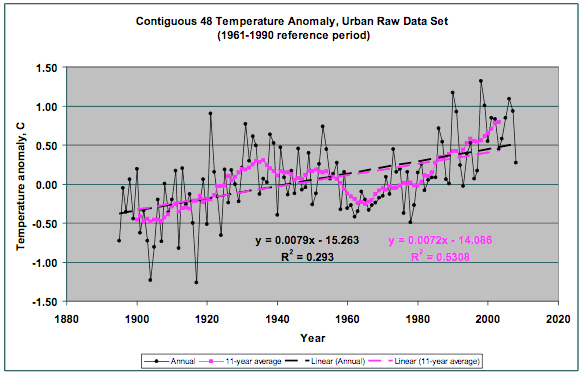
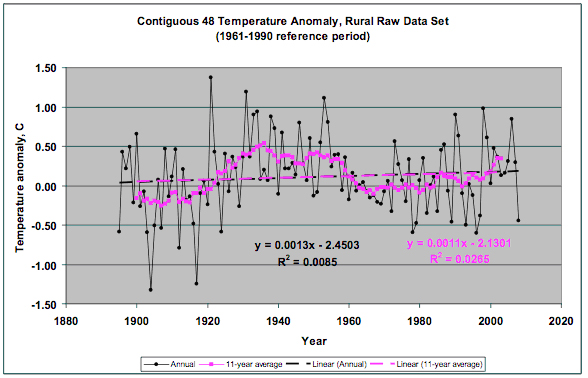
A problem in tying ice core data to modern satellite data to documented long-term global temperature trends lies with the unreliability of the last century and half of instrumental data. These data have been contaminated by urban heat island effects, selective reduction of the number of stations, and uncorroborated corrections to the raw data. The easy solution to this problem is to use only rural data.
|
|
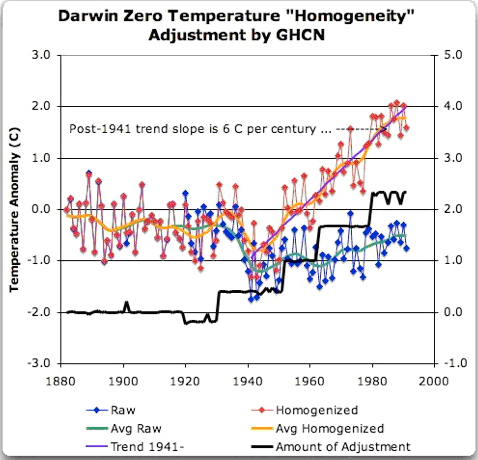
Geologists remain vitally interested in the debate over human effects on climate because they know and understand the history of climate change. Geologists provide a numerical and data-driven baseline for all arguments that purport to demonstrate that modern rates and intensity of climate change are unique in world history. It is the baseline derived from geologic history against which general circulation models projecting temperature change must be measured, and the base upon which to identify unnatural changes, if any. Yet this baseline, although easily accessible, is rarely cited. Compounding this lack of rigor in temperature projections is the increasingly sparse net of instrument stations upon which correlation with satellite information is based. Historical instrument data have been altered, making it difficult to calculate actual rates of change. This paper attempts to provide a summary of data about Holocene rates of change and to suggest a more accurate method to use historical instrument data to ascertain temperature trend and rate changes. Holocene temperatures (starting circa 10,000 BP [1950]) are best recorded in ice cores from Greenland and Antarctica. The data in this paper are derived from oxygen isotope ratios reported from the Greenland GISP2 core (NOAA, 2010). Ice core data are accurate only for the locality where the ice was formed, although the temperature changes are likely reflected throughout the region (Johnsen et al., 1992). GISP2 data are aggregated in twenty–year intervals. Because of that and the natural climate cycles, no time span of less than 100 years can be useful for detection of climate-change-related temperature changes. Natural climate cycles of decadal extent are well known but occur with a frequency that obviates their usefulness for discriminating climate change. Decadal climate cycles and other short-time periods are prone to exaggerated rates of change owing to combinations of decadal oceanographic circulation pattern changes, volcanic eruptions, and similar temporary shifts in heat exchange. GISP2 data truncate at 1980. Gleissberg cycles (60-80 years) are more useful in that they reflect the approximate extent of human life spans. Millennial cycles are clearly climate change cycles. Finally, the extent of the Holocene, approximately the last 10,000 years, is a record of climate change of an interglacial episode, but difficult to relate to human history except by knowledgeable geologists and paleoanthropologists. For all these reasons, this paper restricts calculations of temperature change rates to intervals of greater than one hundred years but less than one thousand years, excepting the demonstration of accelerated rate changes for one short-time period and the over-all climate shift of the Holocene (Table 1). Rates of both cooling and warming are highly varied. Intermediate term (100-1000 years) warming rates average more than double cooling rates, leading to a “sawtooth” configuration of graphical representations of temperature change; that is, rapid rises in average temperatures are followed by slower cooling (i.e., Fitzpatrick, 1995). Very long-term (several thousand years) rates of change tend to be small (examples 9, 10, 11, Table 1), whereas very short rates can be of highly variable and large (example 8, Table 1). A prosaic way of visualizing this phenomenon is to imagine walking up a flight of stairs bouncing a yo-yo. The flight of stairs is a gradual and smooth rise representing a long-time slow rate of climate change, but the yo-yo makes rapid and large movements for the small period of time it is moving in a particular direction, either up or down, representing the rapid and large short-term changes superimposed on a slower rate of rise. It is necessary to distinguish between periods of climate change and of weather. For the purposes of this paper, climate change is considered to take place over multiple decades. Shorter-term spans are regarded as weather cycles. Over the last 9000 years, temperatures in Greenland have gradually cooled 2.68°C, at the rate of 0.028°C per 100 years. This represents extraordinary stability in the ice core record. The modern rate of warming is a low 0.61°C per 100 years (over the last 140 years, 1980 base). This can be compared with the run-up to the Medieval Warm Event at 1.55°C per 100 years, a millennial cycle change, and 0.72°C per 100 years from the Little Ice Age to 1980. One short-term warming rate of 2.23°C per 100 years was calculated (Example 8, Table 1). Such short rapid rates of change are interpreted to be a result of ocean current changes, such as the El Nino and La Nina events and PDO or NAO events. Climate change should be measured on time scales greater than Gleissberg (60-80 yr) events. It should be noted that the rates and absolute values of temperature change based on oxygen isotopes are valid only for the location of the core (Helsen, 2006). The median Holocene temperature at the GISP2 location is -31.45°C Greenland Summit). The current (1980) temperature is -31.3°C. Extrapolation of the rates and values to other latitudes and elevations may require corrections (Helson, 2006).Anecdotal and interpreted temperature variability in temperate zones documented by Lamb (1995) is interpreted to validate the calculated rates of change. Much concern has been expressed about rapid and large temperature swings in the past (e.g., Fitzpatrick, 1995). These swings are associated with the ends of glacial stages and are generally interpreted to be of orbital origin (Zahn, 2002; Naish et al., 2001). It has been demonstrated that the rise in carbon dioxide concentration lags temperature rise by centuries (Caillon et al., 2003; Fischer et al., 1999; Siegenthaler et al., 2005). It is clear that variation in carbon dioxide concentration cannot be the cause of such dramatic temperature changes seen in the ice core record. Thus, present concerns about “tipping points” may be overstated. Relating Rate of Change History to Present Records Temperature data from satellites are now replacing land-based weather stations for inclusion in computer models. These digital data are very useful, but they are not tied to oxygen isotope data because the satellite data have been available only since 1979. The tie between isotope data and satellite data currently is the instrumental records from long-established land stations. Unfortunately, it appears that these data are no longer sufficiently accurate to be relied upon for calculation of rates of temperature change. There are four major problems with the instrumental record.
The result of all these problems is that no credible temperature record for the 19th and 20th centuries now exists. To solve this data gap, a new network of long-record surface stations must be created containing only rural stations of unquestioned location, with corrections limited to statistically valid calculated values from nearby stations to maintain data continuity. As Long (2010) (Figures 3 and 4) has shown, the urban heat island effect is obvious. The effect includes both actual heat island effects, that is, increased temperatures owing to retained heat and blackbody presence, but also corruption of the urban station data by inappropriate station location during urban expansion (Aleo and Watts, 2010). Rather than correct for this effect, restricting the instrument data set used to rural locations provides an uncontaminated base data set. As the graphs show, there is no strong indicator in the contiguous 48 states that an unusual warming is occurring; rather, the major warm event was the rise from 1880 to 1936. This article has attempted to solve the issue of competing visions of temperature history and identification of human effects on climate through reconstruction of past temperature history. This was found to be difficult because instrument data for the last two centuries have not been recalibrated to rural values. Rates of temperature change, however, may be extrapolated, and they demonstrate that for the period of 7800 B.P. (1950) to 1980current rates of temperature change are within historic norms. The current temperature is virtually identical to the median temperature for that same period. A reconstructed rural temperature data set can resolve remaining issues. Geologists have long known that climate changes constantly, in both directions and at many scales of intensity. The foregoing data argue that there is no current climate change or rate change that has not occurred in the past nor will not occur again in the future. Human society must adapt to climate changes. The author thanks his colleagues M. Ray Thomasson, Victor J. Yannacone, Jr., and Leighton Steward for their criticism and helpful suggestions on drafts of this manuscript. Aleo, J. and A. Watts, 2010, Surface Temperature Records: Policy Driven Deception?: Science and Public Policy Institute, Washington, D. C., 111p. Caillon, N., J.P. Severinghaus, J. Jouzel, J-M Barnola, J. Kang, and V.Y. Lipenkov, 2003, Timing of atmospheric CO2 and Antarctic temperature changes across Termination III: Science, v. 299/5613, p. 1728-1731. Dahl-Jensen, D., K. Mosegaard, N. Gundestrup, G.D. Clow, S.J. Johnsen, A.W. Hansen, and N. Balling, 1998, Past temperatures directly from the Greenland Ice Sheet: Science, v. 282, p. 268-271. Dansgaard, W., S.J. Johnsen, H.B.Clausen, D. Dahl-Jensen, N.S. Gundestrup, C.U. Hammer, C.S. Hvldberg, J.P. Steffensen, A.E. Svelnbjornsdottir, J. Jouzel, and G. Bond, 1993, Evidence for general instability of past climate from 250-kyr ice-core record: Nature, v. 364, p. 218-220. Eschenbach, W., 2009, The smoking gun at Darwin Zero: Web accessed 20 September 2010 http://wattsupwiththat.com/2009/12/08/the-smoking-gun-at-darwin-zero/ Fischer, H., M. Wahlen, J. Smith, D. Mastoianni, and B. Deck, 1999, Ice core records of atmospheric CO2 around the last three glacial terminations: Science, v. 283, p.1712-1714. Fitzpatrick, J., 1995, The paradigm of rapid climate change; a current controversy, in L. Carter, M.H., Energy and the Environment; Application of Geosciences to Decision-making: U. S. Geological Survey Circular 1108, p. 20-22. Helsen, M.M., 2006, On the interpretation of stable isotopes in Antarctic precipitation: Ph.D dissertation, University of Utrecht, The Netherlands, 152 p., Web accessed 20 September 2010 http://www.phys.uu.nl/~helsen/PDF/thesis.pdf Johnsen, S.J., H.B. Clausen, W. Dansgaard, K. Fuhrer, N. Gundestrup, C.U. Hammer, P. Iversen, J. Jouzel, B. Stauffer, and J.P. Steffensen, 1992, Irregular glacial interstadials recorded in a new Greenland Ice Core: Nature, v. 359, p. 311-313. Long, E.R., 2010, Contiguous U. S. temperature trends using NCDC raw and adjusted data for one-per-state rural and urban station sets: Science and Public Policy Institute, Washington, D.C., U.S.A., 14 p. McKitrick, R., no date, The graph of temperature vs. number of stations: Web accessed 20 September 2010 http://www.uoguelph.ca/~rmckitri/research/nvst.html Morrissey, E., 2009, NOAA/GHCN “homogenization” falsified climate declines into increases:Hot Air: Web accessed 20 September 2010 http://hotair.com/archives/2009/12/09/east-anglia-homogenization-falsified-declines-into-increases/ Naish, T.R., K.J. Woolfe, P.J. Barrett, G.S. Wison, C. Atkins, S.M. Bohaty, C.J. Bucker, M. Claps, F.J. Davey, G.B. Dunbar, A.G. Dunn, C.R. Fielding, F. Florindo, M.J.Hannah, D.M. Harwood, S.A. Henrys, L.A. Krissek, M. Lavelle, J. van der Meer, W.C. McIntosh, F. Niessen, S. Passchier, R.D. Powell, A.P. Roberts, L. Sagnotti, R.P. Scherer, C.P. Strong, F. Talarico, K.L. Verosub, G. Villa, D.K. Watkins, P.N. Webb, and T. Wonik, 2001, Orbitally induced oscillations in the East Antarctica Ice Sheet at the Oligocene/Miocene boundary: Nature, v. 413, p. 719-723. National Oceanic and Atmosphere Administration, 2010, GISP2 stable isotopes: NOAA: Web accessed 20 September 2010 http://www.ncdc.noaa.gov/paleo/icecore/greenland/summit/document/gispisot.htm National Oceanic and Atmosphere Administration, 2010, United States Historical Climatology Network (USHCN): NOAA, Web accessed 20 Setpember 2010, http://www.ncdc.noaa.gov/oa/climate/research/ushcn/ushcn.html Siegenthaler, U., T.F. Stocker, E. Monnin, D. Lüthi, J. Schwander, B. Stauffer, D. Raynaud, J-M Barnola, H. Fischer, V. Masson-Delmotte, and J. Jouzel, 2005, Stable carbon cycle-climate relationship during the late Pleistocene: Science, v. 310/5752, p. 1313-1317. Watts, A., 2009, Is the U. S. surface temperature record reliable?: Heartland Institute, Chicago, Il., 28 p. Willmott, C.J., S.M. Robeson, and J.J. Feddema, 1991, Influence of spatially variable instrument networks on climatic averages: Geophysical Research Letters, v. 18/12, p 2249-2251. Zahn, R., 2002, Milankovitch and climate: The orbital code of climate change: JOIDES Journal, v. 28/1, p. 17-22.
Copyright © AAPG. Serial rights given by author. For all other rights contact author directly. |