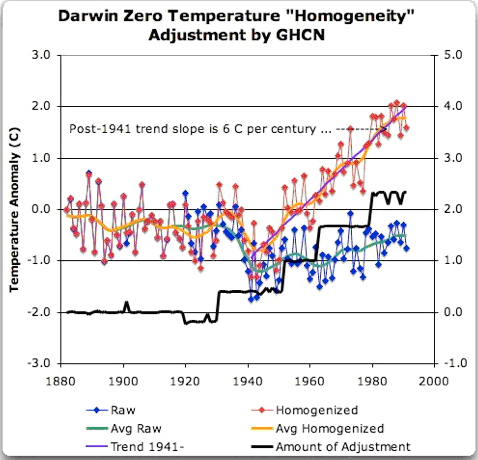
Figure 1. Darwin Zero Homogeneity Adjustments (from Eschenbach, 2009). Black line shows amount and timing of adjustments. The instrument data demonstrate no temperature rise over 100 years, rather a half-degree cooling. The adjustments add 2.5°C to the instrument data starting in 1940, virtually identical to the indicated “corrected” temperature increase. The correction is the temperature rise.