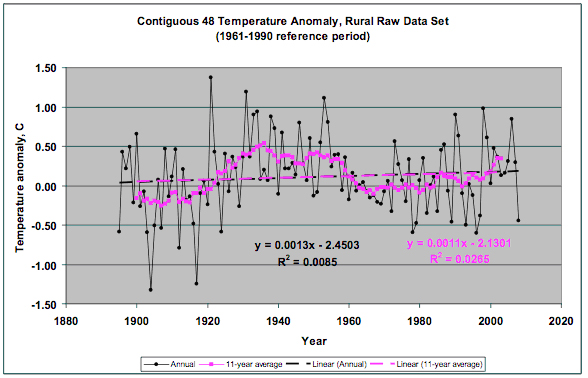
Figure 4. Annual and 11-year average temperature anomaly of rural raw data set for the contiguous 48 states (from Long, 2010). Note that the 1890 to 1965 curves are virtually identical, but they diverge forward; the urban curve rises sharply while the rural curve only slightly rises, demonstrating the urban heat island effect.