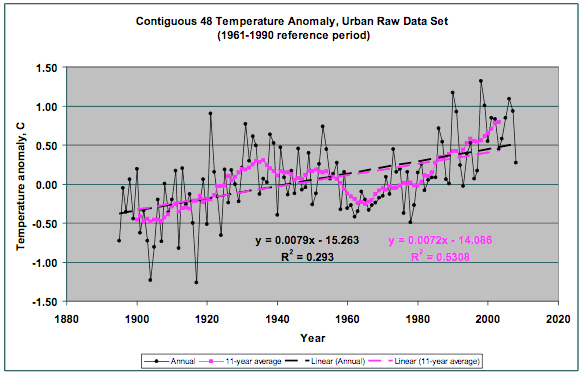
Figure 3. Annual and 11-year average temperature anomaly of urban raw data set for the contiguous 48 states showing large temperature rise from 1960 forward (from Long, 2010).
Figure 3. Annual and 11-year average temperature anomaly of urban raw data set for the contiguous 48 states showing large temperature rise from 1960 forward (from Long, 2010).