Click
to view article in PDF format.
Click
to view article in PDF format.
Analysis of Light Hydrocarbons in Soil Gases, Lost River Region, West Virginia: Relation to Stratigraphy and Geological Structures*
By
W. Harbert1, V.T. Jones2, J. Izzo1, and T.H. Anderson1
Search and Discovery Article #20042 (2006)
Posted December 6, 2006
*Adapted from extended abstract prepared for presentation at AAPG Annual Convention, Houston, Texas, April 9-12, 2006. See AAPG Bulletin, v. 90, p. 715-734 for a more detailed article by same authors with the same title.
1Department of Geology and Planetary Science, University of Pittsburgh, Pittsburgh, PA ([email protected])
2Exploration Technologies, Inc., Houston, Texas
Analyses of near-surface soil-gas samples for light methane through butane hydrocarbons and ethylenepropylene over the Lost River gas field in Hardy County, West Virginia, has revealed sites containing anomalously high concentrations of gases directly above the faulted, eastern limb of the Whip Cove anticline that defines the productive structure. Statistical analysis suggests that approximately 10% of the samples (forty-five out of a total of 471) contain anomalously high concentrations of light hydrocarbons. Fairly active seepage is suggested by the very large saturate to olefin ratios exhibited by the largest magnitude soil gas anomalies. Grids placed on botanically defined anomalies (maple trees in a Climax Oak forest) suggest a seepage-related correlation. Compositional variations divide the soil gas data into two different domains, with gassier compositions to the east and oilier compositions to the west. The gassier anomalies, which are very similar to the Oriskany production gases, are above near-vertical beds of Devonian and older formations, and appear to be sourced by thermal gases derived from these more mature rocks. The oilier compositions of the soil-gas anomalies that follow the strike of the eastern, faulted limb of the Lost River gas field suggests that the dry gases from the Oriskany reservoir are probably mixing with oilier gases derived from less mature organic-rich strata contained in the overlying Devonian shales. Although the soil gas signatures would not have predicted the correct composition for the Lost River dry gas reservoir, the higher concentration samples do fall along strike and within the boundaries of the structural high that forms the trap for the deep gas reservoir. They also identify the Whip Cove anticline as the appropriate structure for drilling.
|
|
The Lost River area, within Hardy County, West Virginia, is one of three oil and gas sites that were chosen for a Geosat test project in the early 1980’s (Matthews et al., 1984; Lang et al., 1985). These sites, known to have subsurface geochemical and mineral resources, were selected to test the usefulness of remotely sensed imagery for resource exploration. The National Aeronautic and Space Administration’s Jet Propulsion Lab (NASA-JPL) provided remotely sensed imagery and made maps of lineations from the interpreted images with the aspiration of identifying potential zones of hydrocarbon leakage. Geosat, a separate nonprofit organization of over 100 companies that produced non-renewable energy and mineral resources, provided personnel and equipment to acquire information based upon field work. The primary goal of the soil-gas portion of this project was to assess the effectiveness of new shallow-probe soil gas collection methods and geochemical analyses to characterize hydrocarbons trapped in deep subsurface reservoirs. Samples were collected in soil and weathered rocks 1.2 m (4 ft) below the surface. The magnitudes and compositions of the near-surface soil gases were used to identify locations of anomalous seepage and in some cases to constrain the source or sources of the light hydrocarbons. Another goal was to assess the distribution of seepage with respect to areas underlain by highly fractured rock, faulted rock and to linear features recorded by vegetation or topography. Equipment and personnel for this project were provided by the Gulf Research and Development Corporation (GR&DC) Geochemistry and Minerals group under the direction of Drs. V. T. Jones and Martin D. Matthews, Mr. John Izzo and assisted by Dr. Harold Lang from JPL. Sample sites, gas well locations and other topographical and geological information were georeferenced by Mr. John Izzo and Dr. William Harbert at the University of Pittsburgh and analyzed using Geographic Information System (GIS) technology on UNIX and WinXP/Pro based system using ARC/INFO Version 7.X-8.3 and ArcView GIS Version 3.0-8.3 software.
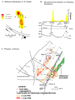
In the study area, lower Mississippian strata comprising Purslane and Rockwell Formations (Pocono group) (Mp) and underlying units as low as the upper Ordovician Martinsburg Formation (Om) and the Trenton group (Ot) crop out (Figure 1). The lower Mississippian formations extend along the hinges of the Whipcove and Sideling Hill synclines and form the highest topographic points in the region. The oldest strata, upper Ordovician Martinsburg and Trenton, crop out in the southeast within the core of the Adams Run anticlinorium. Near-surface soil-gas samples were collected in these strata with the exception of the Pocono and Trenton groups. The sample sites near producing gas wells are located in the Devonian Chemung Formation (Dch). The Lost River gas field in the South Fork district of Hardy County, West Virginia, parallels the regional structural trend (N 32oE). The field is about 10 miles long and lies within the confines of the Whipcove anticline east. The Lost River gas field in the South Fork district of Hardy County, West Virginia, parallels the regional structural trend (N 32oE). The field is about 10 miles long and lies within the confines of the Whipcove anticline east.
A simple color dot map of methane (Figure 2A) and ethane (Figure 2B) illustrates the magnitudes (dot sizes) and compositions (color) that clearly define these two different compositional signatures that appear to reflect different geological domains. In addition to major compositional differences, these dot maps also show that there are a series of large magnitude anomalies that occur along the eastern, faulted strike of the Whip Cove anticline that forms the trap for the Lost River gas Field. The most anomalous sites (larger sized dots) were selected as the sites having ethane greater than 3 ppm. With the exception of these obvious anomalies, most of the samples collected off the structure have very low concentrations. Background concentrations for methane and ethane suggested by these dot maps are 5.627 and 0.359 ppm, which are fairly close to the median values. The compositional signatures displayed are defined by the methane to ethane, methane to propane, and methane to butane ratios, as defined by Pixler (1969), for the western and eastern domains, respectively. All sites regardless of magnitude are plotted on the leftmost portion of each of the Pixler Plots (Figure 2C and 2E), and only the most anomalous sites (shown by the larger dots) within each domain are plotted on the rightmost Pixler Plots (Figure 2D and 2F). Another complementary representation of these magnitude and compositional differences can be shown by a propane dot map (Figure 3A) that relates dot sizes to propane concentrations and the color of the ethane to propane ratio. Colors have been selected by dividing the ratio data into quartiles, with the lowest two quartiles as blue and green and the upper two quartiles as yellow and red. As with the methane dependent Pixler Plots, the C2/C3 ratio also divides the soil gas data into western and eastern domains. Color-coded scatter plots of the C2/C3 ratios, included as Figure 3B and 3C, demonstrates that this independent C2/C3 ratio also appears to be controlled by source differences in the western and eastern geological regimes. Neither of these hydrocarbons is generated via biogenic processes. The fundamental assumption of near-surface hydrocarbon prospecting techniques is that thermogenic hydrocarbons generated and trapped at depth leak in varying quantities toward the surface of the Earth. These seepage hydrocarbons measured as soil gas have well-defined compositions that are controlled by the underlying source rocks (Jones and Drozd, 1983; Jones et al., 2000). Typical plots and diagrams used to define and display both soil gas and reservoir gas compositions are shown in Figure 4 (Katz and Williams, 1952; Pixler, 1969; Nikonov, 1971). Variations in the numerical values of these hydrocarbon constituent ratios have been shown to provide identifying compositional signatures that are different for gas, condensate, and oil type reservoirs. These ratios work equally well for both surface seeps and for reservoir gases and can be used to predict whether the source rocks and even the reservoirs within an unexplored area are more gas or oil prone. These same schemes have been used to interpret the Lost River soil gas data. Another methane anomaly (Figure 5A) was found within an area that contained a stand of maple trees, identified as the “hook-shaped maple anomaly”. A picture of this anomaly, shown in Figure 5B taken in the Fall when the leaves change color, explains the name attributed to this anomaly. A supplemental, closer detailed (150 ft. increment) mini-survey of nineteen soil-gas samples was collected in a U-shaped pattern within this stand of maple trees. The hook-shaped maple anomaly is near the hinge of the Whipcove anticline east, where the geometry of the structure might allow more direct communication with the Lost River reservoir. Although dense vegetation in the Lost River area precluded the direct observation of rocks and soil by satellite imagery, a re-interpretation of LANDSAT Thematic Mapper images revealed stands of red maples on east-facing slopes and in the bottom of valleys and ravines. Red maples are not expected to be abundant in a climax forest because they are usually dominated (~88% in the study area) by various oak and hickory species (Lang et al., 1985). Three stands of maple trees were identified as recording anomalous growth conditions. These groups of maple trees were evaluated by a botanist and found to be too old and well-established to be related to either burn areas or clear cuts. These maples were detected visibly by their yellow foliage in contrast to the surrounding green oak trees. It was postulated that methane leaking upward through fractures, concentrated in the soil at the surface, could create a reducing environment, providing the maples with a competitive advantage, since the presence of gassy soils are not conducive to an oak-hickory habitat, whereas red maples are tolerant of methane-rich soil and anaerobic soil conditions (Leone et al., 1977; Flowers et al., 1981). A propane contour map of the “hook-shaped maple anomaly” is shown in Figure 6A, along with a generalized propane profile (Figure 6B) and a regional propane contour map (Figure 6C). Figure 6B also shows an idealized subsurface cross-section through the Lost River field in West Virginia along with a propane profile (Matthews et al., 1984, Jones et al., 2000). From this profile and with some knowledge of the geology, it can be seen that the large propane anomalies that lie on strike and just east of the crest of the field are likely related to updip leakage of the fractured Devonian Oriskany reservoir at depth. Blind drilling on the outcrop anomaly would have resulted in a dry hole, whereas drilling just west of the fault anomaly (on the deeper structure) would have resulted in discovery of the field. Appropriate geological modeling and interpretation is always recommended for identifying a drilling location.
Flower, F. B., E. F. Gilman, and I. A. Leone, 1981,
Landfill gas, what it does to trees and how its injurious effects may be
prevented: Journal of Arboriculture, v. 7, p. 43 Harbert, W., V.T. Jones, J. Izzo, T.H. Anderson, Analysis of light hydrocarbons in soil gases, Lost River region, West Virginia: Relation to stratigraphy and geological structures: AAPG Bulletin, v. 90, p. 715-734. Jones, V.T., and R.J. Drozd, 1983, Predictions of oil or gas potential by near-surface geochemistry: AAPG Bulletin, v. 67, p. 935-952. Jones. V.T., M.D. Williams, and D.M. Richers, 2000, Light hydrocarbons for petroleum and gas prospecting, in H. Hale, ed., Geochemical remote sensing of the subsurface: Elsevier Science B.V., Handbook of exploration geochemistry, v. 7, p. 133-212. Katz, D.L., and B. Williams, 1952, Reservoir fluids and their behavior: AAPG Bulletin, v. 36, p. 342-358. Lang, H. R., J. B. Curtis, and J. S. Kovacs, 1985, Lost River, West Virginia, petroleum test site report, Section 12: The Joint NASA/Geosat Test Case Project, final report, 104 p.
Leone, I. A., F. B. Flower, J. J. Arthur, and E. F.
Gilman, 1977, Damage to woody species by anaerobic landfill gases:
Journal of Arboriculture, v. 3, p. 221 Matthews, M.D., V.T. Jones, and D.M. Richers, 1984, Remote sensing and surface hydrocarbon leakage: International Symposium on Remote Sensing for Exploration Geology, Colorado Springs, Colorado. Nikonov, V.F., 1971, Distribution of methane homologs in gas and oil fields: Akademiya Nauk SSSR Doklady, v. 206, p. 234-246. Pixler, B.O., 1969, Formation evaluation by analysis of hydrocarbon ratios: Journal of Petroleum Technology, v. 21, p. 665-670. |