Print this page
Click on image to view enlargement.
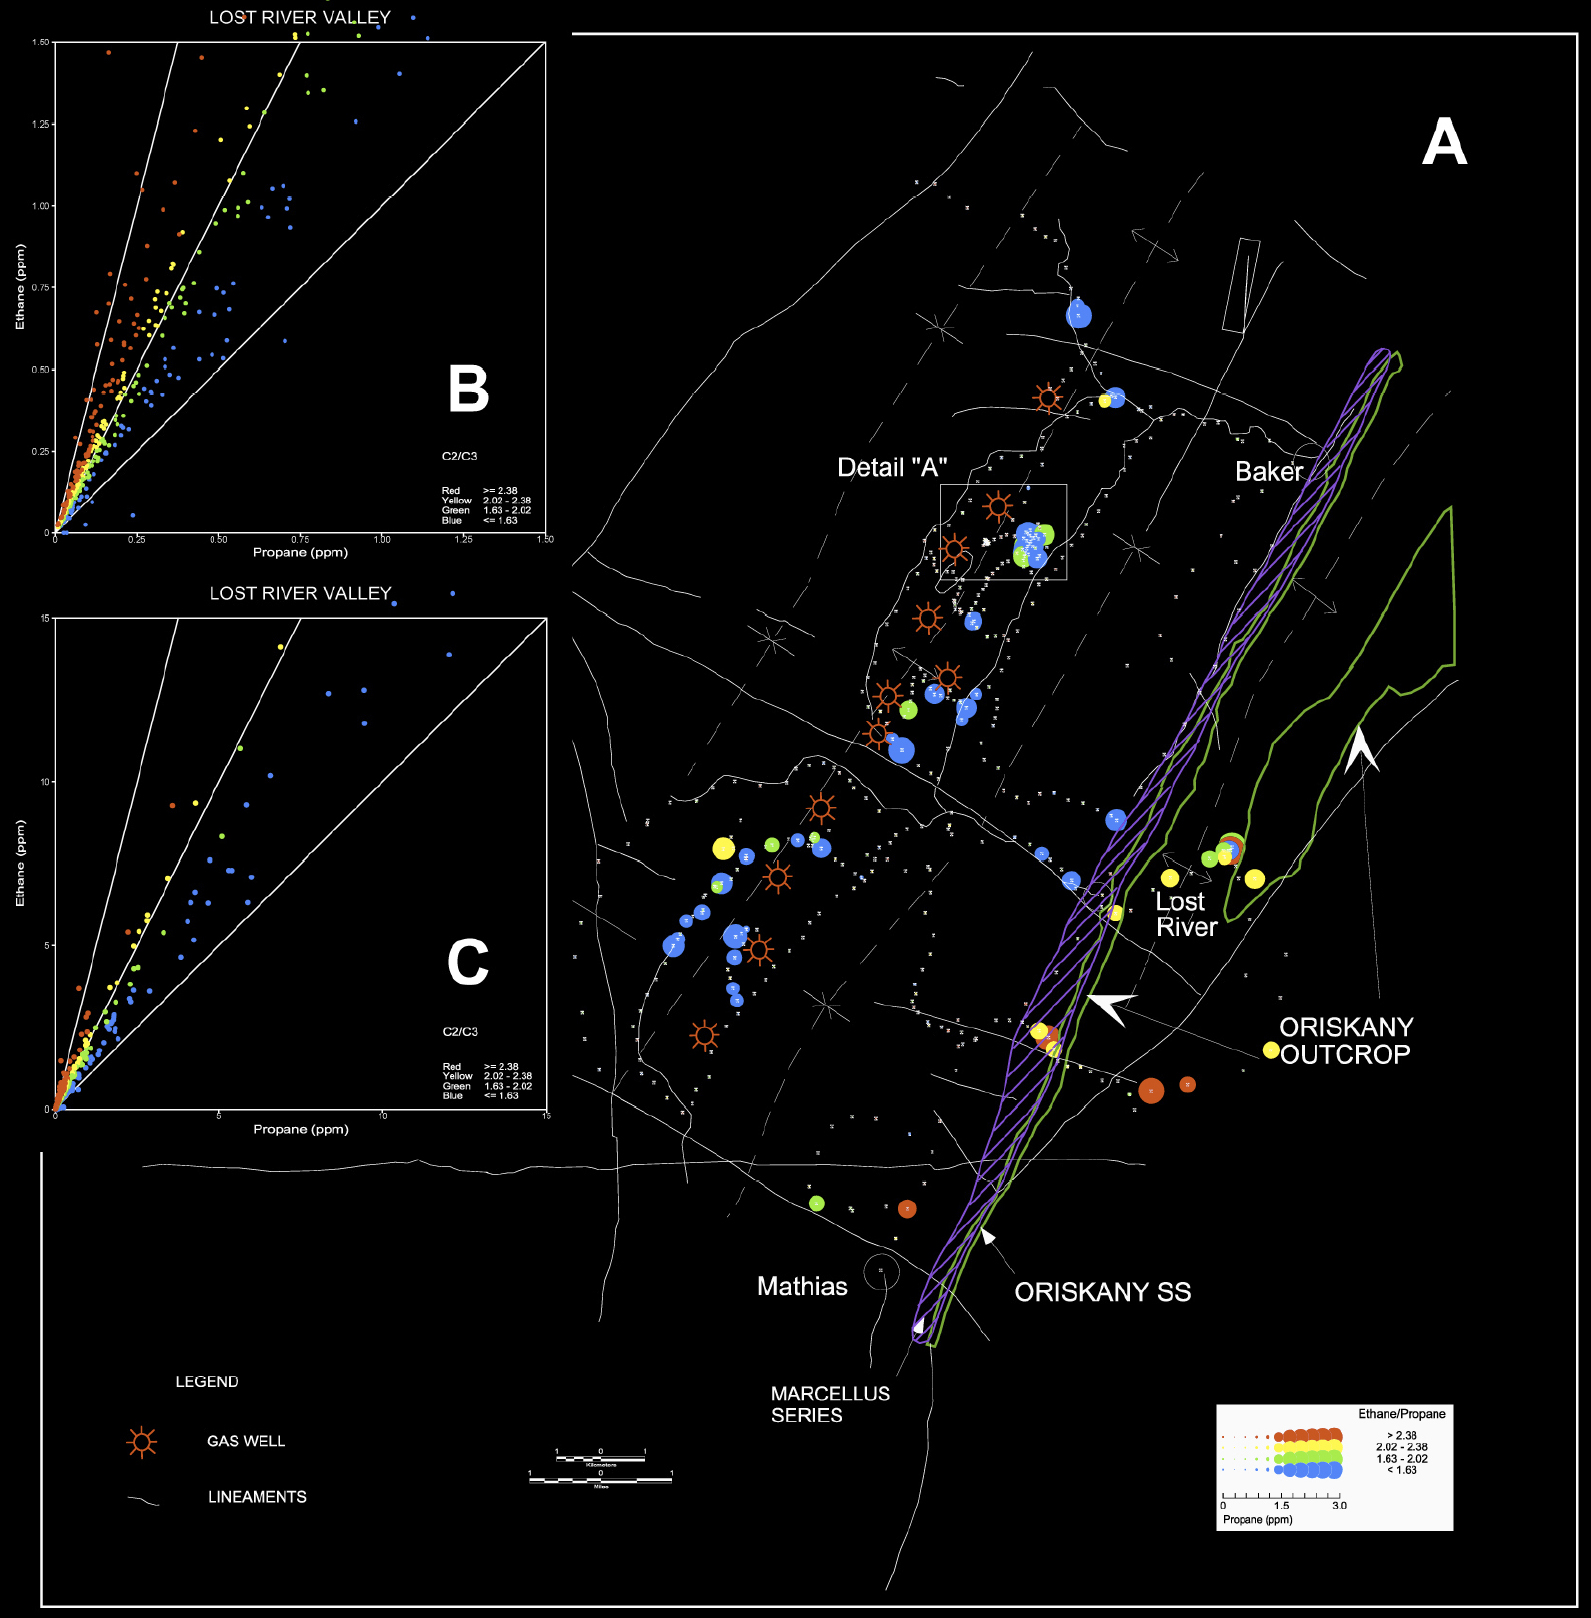
Figure 3. A. Color dot map of propane. B, C. Color-coded scatter plots of C2/C3 ratios.