Click on image to view enlargement.
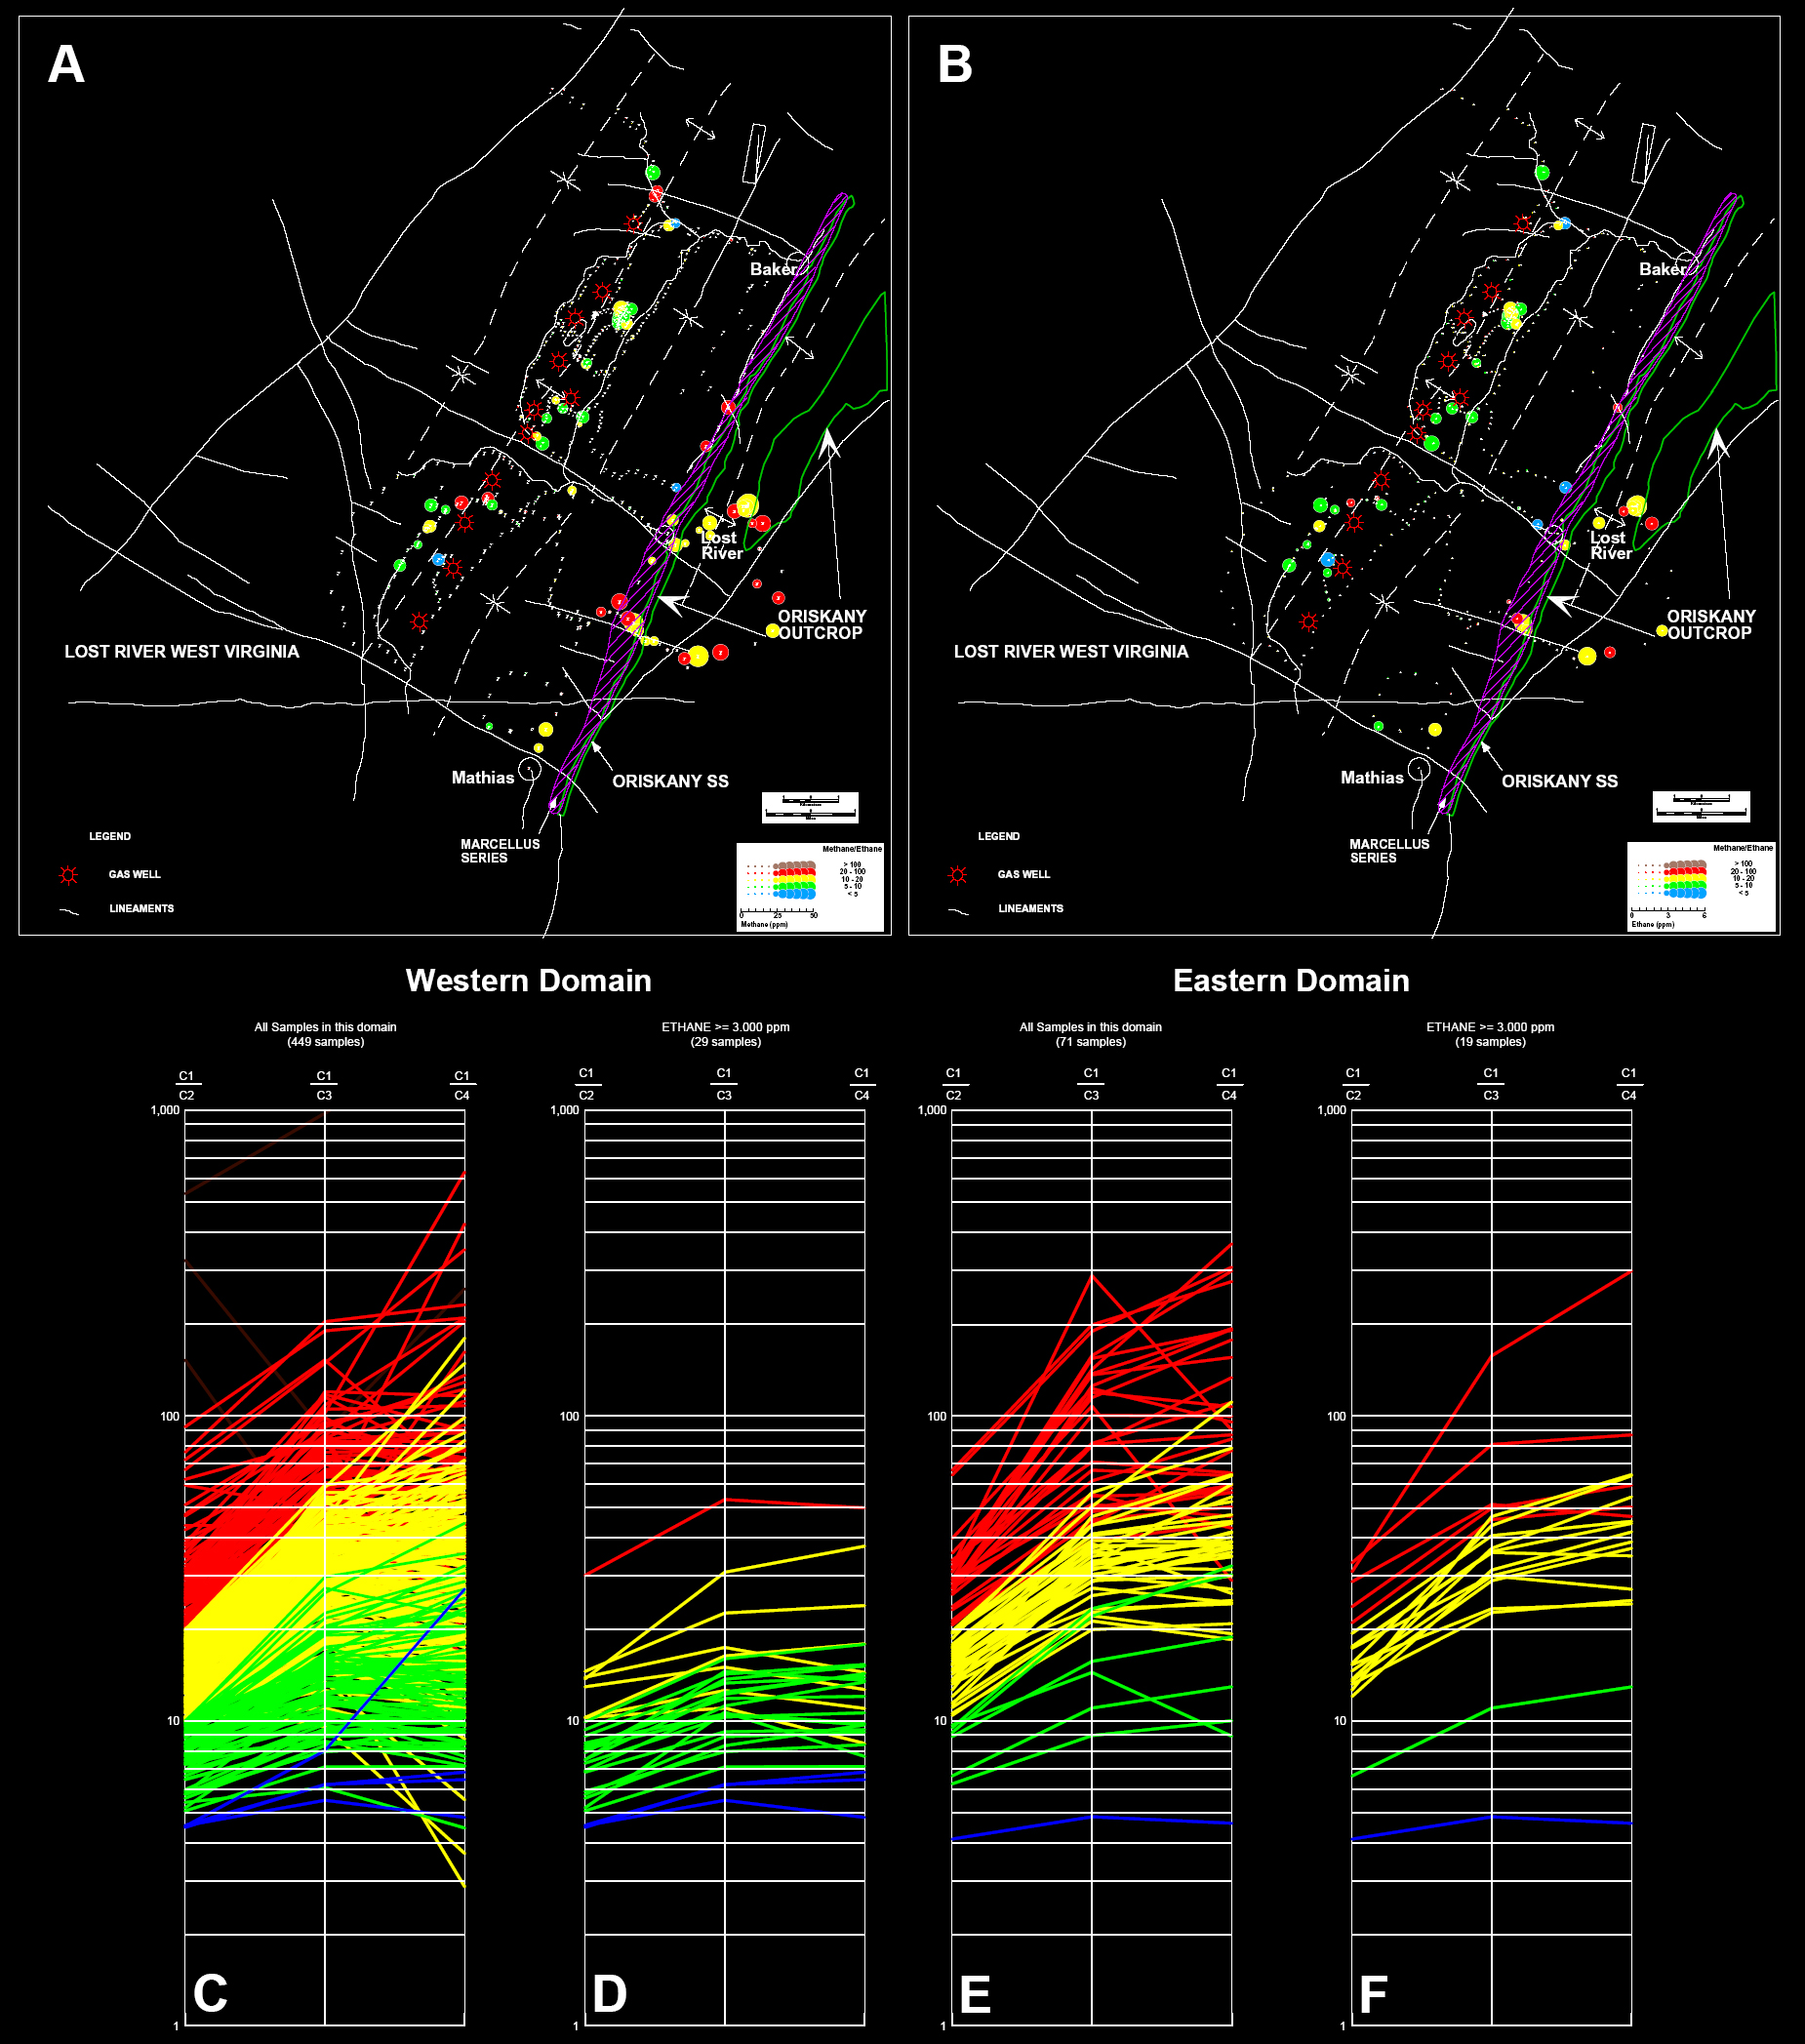
Figure 2. A. Color dot map of methane. B. Color dot map of ethane. C, D, E, F. Compositional signatures defined by the methane to ethane, methane to propane, and methane to butane ratios, as defined by Pixler (1969). C. All samples in western domain. D. 29 Most anomalous samples (ethane >= 3.000 ppm), western domain. E. All samples in eastern domain. F. 19 Most anomalous samples (ethane >= 3.000 ppm), eastern domain.