![]() Click to view article in PDF format.
Click to view article in PDF format.
Resistivity Image Data, Vøring Basin, Offshore Norway*
By
Ian Goodall1, Ian Westlake2, Grete Block Vagle3, Ivar Mundal3, and Matthew Mulcahy4
Search and Discovery article #10049, (2003)
*Adapted for online presentation from Chapter 11, AAPG Methods in Exploration Series, No. 13, with the same title and by the same authors (Goodall, Ian, Ian Westlake, Grete Block Vagle, Ivar Mundal, and Matthew Mulcahy, 2002, Resistivity Image Data, Vøring Basin, Offshore Norway, in Geological Applications of Well Logs, M. Lovell and N. Parkinson, eds.: AAPG Methods in Exploration No. 13, p. 143-159). This publication, copyrighted 2002 by The American Association of Petroleum Geologists, with all rights reserved, is available for sale from the AAPG Bookstore (http://bookstore.aapg.org), where its “address” is: (http://bookstore.aapg.org/detail.html?cat_no=524&ticket=7671547787930892&uniqueid=200310011110).
1Badley Ashton & Associates Ltd., Horncastle, U.K.; currently Goodall Geoscience Ltd., Horncastle, U.K.
2Badley Ashton & Associates Ltd., Horncastle, U.K.
3BP Norge AS, Forus, Norway
4Schlumberger Wireline & Testing, Aberdeen, U.K.
The Luva Discovery well, 6707/10-1, targeted the Santonian to Campanian Nise Formation on the Nyk High structure in the Vøring Basin, offshore Norway. It encountered a 156-m gas column in a section 1200 m thick, dominated by sheet sandstones of excellent quality deposited in a basin-floor complex. This section comprises stacked sand systems, each as much as 200 m thick, that have been mapped across the Vøring Basin. They are separated by hemipelagic "fines blankets" deposited during periods of shutdown in sand supply. Vertical transmissibility in the sheet sandstones and hence potential reservoir performance are controlled by the extent of sand-body amalgamation and the distribution of caps to individual, dewatered high-density turbidite beds. These caps range in composition from glauconitic, carbonaceous-rich, and mud-prone/mudclast-rich sandstones to heterolithic deposits/shales and have markedly different vertical permeabilities ranging from less than 1 to about 1000 md. These bed caps have nondiagnostic conventional open-hole log responses, but are identified easily on Formation MicroScanner (FMS+) images. In addition, the analysis of paleotransport directions derived from trough cross-stratified, glauconitic sandstone-bed caps--interpreted as lower-density deposits associated with waning flow and identified using the FMS images--provides a mechanism to test regional paleogeographic interpretations made from 3-D seismic data. The results are not conclusive, but they highlight uncertainties in the model for sand supply and dispersal in the Vøring Basin.
+FMS is a registered trademark of Schlumberger Ltd.
|
|
Recent exploration for petroleum in Norway has concentrated on plays in the Norwegian Sea, north of lat. 66 degrees. Prospects in this area typically are in water deeper than 1200 m; without recent advances in drilling and production technology, these areas could not have been explored. Despite being technically feasible, exploration for petroleum in the Norwegian Sea is expensive. Therefore, to minimize costs, the number of wells drilled must be limited. Sufficient volume of geological data must be acquired early in exploration and field appraisal. A major gas discovery was made in 1997 by the PL218 license group (BP Norge AS, Norsk Conoco AS, Esso Exploration and Production Norway AS, and Statoil ASA) in Block 6707/10. This was the Luva Discovery, which was in 1200 to 1500 m of water. To minimize long-term costs, a significant amount of data was acquired in the discovery well, 6707/10-1. This information included Formation MicroScanner (FMS) data and substantial sections of core, which collectively provided a means to improve planning of exploration and evaluation of the Luva Discovery.
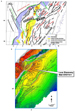
LOCATION AND RESERVOIR GEOLOGY OF THE LUVA DISCOVERY The Luva Discovery is in the Vøring Basin near lat. 67 degrees N, long. 7 degrees E, off the coast of mid-Norway (Figure 1a). The field was discovered in 1997 by exploration well 6707/10-1 (Figure 1b); it contains a gas column 156 m thick (Figure 2). The discovery is on the Nyk High, which is a north-to-northeast-trending, three-way dip-closed structure bounded on the northwest by a major fault (Figure 1b). The structure was mapped on 3-D seismic data on an Upper Cretaceous K80 (Campanian) amplitude trough; it contains bright amplitudes and a flat spot, which were targeted successfully by the discovery well. The Vøring Basin is on the mid-Norway passive margin of the northeastern Atlantic Ocean; it is approximately 400 km long and 100 km wide. It has a north-northeast-trending structural grain, controlled by breakup early in the Cretaceous and initiation of ocean spreading (Lundin and Dore, 1997; Walker et al., 1997). The Vøring Basin is bounded on the northwest by the Vøring Escarpment and the Gjallar Ridge, and on the southeast by the Fles Fault complex and Utgard High (Figure 1a). It is interpreted as having developed from major extension across a ramp-flat fault system, resulting in the hanging-wall rollover of the Gjallar Ridge and the Vigrid Syncline (Figure 1a) (Bjørnseth et al., 1997). Basin extension began in the early Cenomanian with emplacement of flood basalts along thinned basin axes. These basalts are extensive, large, upstanding features that are interpreted as seamounts; they are likely to have been major bathymetric features on the basin floor (Lundin and Dore, 1997). The initial extension was followed by Cenomanian faulting in the inner Vøring Basin and by uplift of the outer Vøring and Lofoten margins (Bjørnseth et al., 1997). Uplift was associated with a regional unconformity that is most pronounced on the Gjallar Ridge, to the west, and on the Nyk High, and sand was deposited in a regional depocenter in the Rås Basin to the southeast (Figure 1a) (Bjørnseth et al., 1997; Lundin and Dore, 1997). A second extensional event, Santonian to Campanian, resulted in more faulting on the Nyk High and along the Fles Fault complex (Figure 1a), which generated a major depocenter in the Vøring Basin (Bjørnseth et al., 1997). In the Late Cretaceous, this depocenter was filled by substantially thick sand; it was inverted in several compressional phases--in particular, during the early Eocene and middle Oligocene--and structures formed that are targets for petroleum exploration.
The Luva Discovery is developed in the
sand-prone Nise Formation (Figure
2). The Nise was deposited during the early Santonian to early
Campanian; it can be correlated across the Vøring Basin (Bjørnseth et
al., 1997). Its age corresponds to the units K76 to K80 of BP's genetic
sequence-stratigraphic scheme, which provides a framework for
correlation of these strata in the Shetland Islands, North Viking Graben,
Norwegian Sea, and East Greenland; the framework was used in this paper.
A stratigraphic section with abundant sandstone and thickness of 1300 m
was predicted in the Nyk High area by an evaluation of 3-D seismic data.
However, the proportion of sandstone could not be confirmed prior to
drilling, because well data were not sufficient. The discovery well,
6707/10-1, penetrated 1200 m of gross reservoir section; net-sandstone
content is high, sandstone is of excellent reservoir quality and is
slightly affected by diagenesis (
The K76-to-K80 section is composed of sandstones and intercalated mud rocks that can be rationalized into three genetically related depositional elements: sheet sandstones, fringe elements, and blankets of hemipelagic fines. Each of these typically is several tens of meters thick; geometries were interpreted from 3-D seismic data (Figure 3a; scale nomenclature as defined by Mutti and Normark, 1987):
· Sheet sandstones. The sheet-sandstone depositional element is dominated by stacked, meter-scale beds of clean, dish- and pipe-dewatered, fine- to medium-grained sandstone interpreted as high-density turbidites. These are erosively amalgamated or, more commonly, are capped by "slurried" bed "tops" rich in carbonaceous material (or "carbonaceous-rich."), mudclast-rich "attached" debris flows ("attached" is used here to describe genetic relationship with underlying sandstones), or flat-laminated heterolithic beds and shales, which record the combination of deposition from low-density turbidity currents and/or hemipelagic fallout. High-density turbidite deposits with low-density, structured, highly glauconitic sandstone caps are also developed, but are not of significant volume. · Fringe elements. The fringe-element depositional units comprise mostly silt- and sand-laminated heterolithic deposits (or "heterolithics"), intercalated with common, decimeter-thick, dewatered high-density turbidite sandstones. Relative to the sheet sandstones, these beds were deposited either in relatively distal settings or in lateral settings. · Blankets of background hemipelagic fines. The blanket-like deposits of hemipelagic fines are dominated by flat- to parallel-laminated mud rocks commonly intercalated with silt- and sand-laminated heterolithic deposits. Respectively, they are interpreted as basinal hemipelagic fallout deposits, interspersed with episodic, low-density turbidites. Extended periods of hemipelagic deposition are indicated by thick strata of highly bioturbated green mud rock that overlie laminated, turbiditic black mud rock.
These relatively small-scale depositional elements are the building blocks of the reservoir. They are organized into stacked, large-scale systems as thick as 200 m, each of which has a diagnostic, bow-shaped gamma-ray log motif that is the record of progradation, aggradation, and abandonment of a turbidite sheet-sand system (Figure 3a). There is no evidence of significant erosion or of bed-scale synsedimentary deformation that would be associated with the steeper depositional gradients and instability of a slope environment (e.g., slump deposits). This lack of evidence implies that the sheet sandstones and associated fringe elements were deposited in a basin-floor setting (Figure 3b). The scale of this basin-floor sheet-sand complex is difficult to quantify. The complex has been mapped beyond the PL218 license by use of seismic data; it is considered to be extremely extensive, potentially several hundred kilometers long, and several tens of kilometers wide. High-density turbidity currents were the dominant transportational process that delivered sand to the basin floor (Lowe, 1982). Rapid collapse and/or sustained deposition by hindered settling of flows (Kneller and Branney, 1995) resulted in bed-scale dewatering fabrics. Flow segregation produced various kinds of bed caps, which range from carbonaceous-rich sandstones to "attached" mud-prone debris flows. Decimeters to meters thick, mud-prone debris-flow deposits also are commonly intercalated with mud rocks, in the fringe elements and in background hemipelagic "fines blankets." Whereas these could be interpreted as run-out deposits of "attached" debris flows that were beyond the limits of sand deposition, they are more likely to be the record of entirely separate flow events, not linked to deposition of high-density turbidites. These debris-flow deposits may be products of slope- or canyon-wall failure up-depositional-dip to the main sand supply, or they may have been sourced in a transverse slope setting. Substantially increased amalgamation of sandstone beds toward the center of each bow-shaped log response reflects a period of maximal sediment input and is characterized by a smoother gamma-ray motif, which is evidence of the absence of bed-cap fines (Figure 3b). The sheet-sandstone systems are increasingly mud-prone toward their lower and upper margins. They are separated by "fines blankets"--each several tens of meters thick--of sandstone and mud rock intercalated on the scale of centimeters. The "fines blankets" were deposited by low-density turbidity currents and background-suspension settling that marked shutdowns in sand supply. The scale and distribution of these "fines blankets" form the principal, large-scale layering of reservoirs in the K76-to-K80 section. However, the presence or absence and distribution of thin heterolithic/shale caps of high-density turbidite beds and the extent of sand-body amalgamation are likely to determine the performance of each dynamic reservoir layer. This compound factor controls the vertical transmissibility of the petroleum-bearing sandstones (Figure 4). Therefore, an accurate model of the vertical distribution and lateral extent of nonreservoir heterolithic/shale caps is critical to understanding the performance of petroleum-bearing sections, because these rocks control vertical connectivity.
Current understanding of the depositional setting and sand-body architecture of the K76-to-K80 sandstones in well 6707/10-1 is based largely on detailed evaluation of a 177-m-thick, continuously cored section from the uppermost, gas-bearing part of the K80 sand body. Models based on this core were extrapolated to the uncored underlying sections by calibration to open-hole log responses and by interpretation of an extensive FMS data set (Figure 2). This integrated approach formed the basis for the current geological model of the Luva Discovery.
Data from Cores and Formation MicroScanner Core recovered from the uppermost, gas-saturated part of the K80 sand body has been rationalized into a nongenetic core-lithotype scheme, in which each gravity-flow event has been described in detail, on a bed-by-bed basis. For example (Figure 4a):
· Volumetrically dominant sandstones are classified in terms of texture (grain size of sand and detrital-clay content) and internal structure, with emphasis on the intensity, type, and distribution of dewatering fabrics. The dewatering fabrics potentially affect permeability; for example, a consolidation-laminated bed probably has "horizontal" pathways of permeability, whereas a pipe/ sheet-structured bed is likely to have "vertical" pathways. · In contrast, detailed examination of the composition, color, and internal structure of intercalated mud-prone fines facilitates discrimination among turbiditic, debris-flow, and hemipelagic components, which is captured by a simple lithologic classification into heterolithic deposits, mud-prone conglomerates, and mud rocks, respectively.
This approach provides detailed data that are integrated with an extensive conventional and a special core-analysis data set. These are the basis for the depositional model and, more important, for the petrophysical rock typing that can be input into the Luva Discovery reservoir model. These core-based data can clearly be scaled up to capture the distribution, origin, and geometries of the gravity-flow deposits, at a scale that accurately and consistently describes key, bed-scale heterogeneities in the K76-to-K80 reservoir. However, these heterogeneities have poorly diagnostic conventional open-hole log responses; therefore, they can be identified and described accurately only in the extensive, uncored section that underlies the gas column, by use of high-resolution FMS data. The need to identify these heterogeneities was the rationale behind classification of FMS data into a genetic-image facies scheme (Figure 4).
Interpretation of Formation MicroScanner Data Evaluation of the extensive FMS data set acquired in the K76-to-K80 section was undertaken using Schlumberger GeoFrame software for borehole-image interpretation, installed on a Sun Sparc workstation. The first stage of evaluation was to calibrate the recovered core to the processed FMS data, to ensure that the image responses on which interpretations were based were understood fully and were verified by the rock data. Then FMS data were evaluated by the following approach:
· Lithologies were determined by using an extensive suite of conventional open-hole logs. This involved analysis of the gamma-ray, neutron-porosity, density, and sonic logs. Caliper curves of the General Purpose Inclinometry Tool (part of the FMS tool string) were also used to evaluate image quality. · Specific-image facies designations were made by detailed, bed-by-bed analysis of the textures/fabrics resolved by the static- and dynamic-normalized FMS images. To aid in the observation of features, these images were viewed at different scales, in 2-D and 3-D modes, and with varying degrees of image enhancement. When image facies classifications were made, care was taken to ensure that artifacts of drilling and of data acquisition and processing were not misidentified as sedimentary features. · Bedding surfaces were identified and handpicked by using the borehole-image-interpretation software; the surfaces were classified according to their origins. These attribute-coded bedding-surface orientation data formed the basis for evaluation of both structural-dip and paleotransport directions; they are illustrated by Figures 5 and 6.
In the absence of core control, the genetic-image facies used to describe the petroleum-bearing sheet sandstones are an accurate means to record the heterogeneity of permeability in the K76-to-K80 reservoir. These deposits are composed of stacked, meter-scale beds of dewatered, high-density turbidite sandstone. The resolution of dewatering fabrics is variable. Dewatering dishes and consolidation laminae commonly are resolved by impersistent, slightly discordant nonplanar features, although locally these and all pipe structures are not resolved, because their resistivity contrast is not sufficient to be detected by the FMS tool. Five types of sheet sandstone are identified, each with reservoir properties very different from properties of the others. They are distinguished easily on FMS images (and indeed in core) by the presence or absence, the compositions, and the origins of bed caps (Figures 4b, 5, and 6):
· Amalgamated sheet sandstones (rSa). Meter-scale beds of dewatered high-density turbidite sandstone compose the amalgamated sheet sandstones (Figure 5a). Bed caps are absent, either because they were not deposited or were eroded. Vertical permeabilities of these sandstones typically are more than 1000 md; therefore, the sandstones have high reservoir potential. They are characterized by blocky, low-gamma-ray motifs. FMS images resolve indistinct beds bounded by flat-lying, planar, and low-angle surfaces of erosion. · Sheet sandstones with cross-stratified glauconite-rich caps (rSs). Dewatered beds of sandstone with prominent caps of finer-grained, compacted, ripple cross-stratified, highly glauconitic sandstone as thick as 100 cm make up this variety of sheet sandstone. Vertical permeability ranges from 100 to 1000 md. They are characterized by a highly serrate gamma-ray motif that shows evidence of response to concentrations of glauconite grains. FMS images resolve decimeter-scale trough cross-beds in which laminae of higher resistivity are correlated with concentrations of glauconite pellets. They are illustrated in Figure 7. · Sheet sandstones with carbonaceous-sandstone-rich caps (rSbm). These dewatered sandstones have prominent, upward-fining caps of gray sandstone that is rich in carbonaceous material (Figure 5b). Typically, vertical permeabilities are less than 100 md. The gamma-ray log motif is serrated and nondiagnostic but recognizable on FMS images by a highly layered, bedded fabric. In the gas zone, carbonaceous-sandstone-rich bed caps are resolved by thin, typically unstructured to weakly structured, low-resistivity layers that bound beds (Figure 5b). (Note: The resistivity response of these caps is fluid-zone dependent.) · Sheet sandstones with "attached" debris-flow caps (rSd). The uppermost parts of these sheet sandstones are unorganized, slurried, mudclast-rich sandstones as thick as 50 cm (Figure 6a). Typically, the vertical permeability of these beds is less than 10 md. However, the bed tops are likely to be less extensive laterally than the blanketing background fines, because there is high potential for erosive scouring of beds by turbidity currents in proximal/axial locations relative to the 6707-1 well location and because of an offset sand-body architecture. The offset architecture is related to compensation stacking of individual turbidite beds in the sand systems. These caps are recorded as gamma-ray spikes; therefore, they are easily misidentified on open-hole logs. However, they have diagnostic, chaotic FMS images with characteristic, steeply dipping internal surfaces that resolve concentrations of large mudclasts (Figure 6a). · Sheet sandstones with shale/heterolithic caps (rSbs). In these beds of massive/dewatered sandstone, the uppermost sets of strata are background hemipelagic shale and low-density turbidite heterolithic deposits as thick as 20 cm that potentially have large areal extent. Permeability of these caps typically is less than 1 md; therefore, they are important heterogeneities in the K76-to-K80 reservoir. These sandstones have nondiagnostic, serrate gamma-ray motifs but can be identified easily on FMS images by thin but well-defined, highly structured, relatively low-resistivity layers (Figure 6b; light blue lines). The resistivity response of these caps is fluid-zone dependent.
Thick and laterally extensive blankets of background hemipelagic fines separate the K76-to-K80 sand bodies. They commonly contain intercalated packages of turbiditic mud rocks and centimeter-scale, silt-prone, low-density turbidite beds, both of which can be identified easily on FMS imagery. These nonreservoir sections can be rationalized into three genetic-image facies.
· Laminated mud rocks (rMl). Basinal hemipelagic fallout deposits make up the laminated mud rocks. They have wide neutron-density separations and are characterized on FMS images by a weakly defined flat/parallel lamination on the scale of centimeters. · Mottled mud rocks (rMm). The mottled mud rocks are turbiditic. They have wide neutron-density separations similar to those of laminated mud rocks, but they are characterized by diagnostic unstructured/mottled FMS images. · Laminated heterolithic deposits (rHl). Sections of laminated heterolithic deposits are mud rock with intercalated, low-density turbidite sandstone beds of thicknesses measured on the scale of centimeters. Their mud rock neutron-density separations are highly varied; they reflect the abundance of intercalated sandstones. On FMS images, they are characterized by a diagnostic, strongly layered fabric. Intercalated clean sandstone beds are resolved as prominent resistive laminae.
These turbiditic packages probably are the lateral/distal deposits of sand-prone depositional systems; hence, they indicate the proximity of sand bodies near to but not penetrated by the borehole. Therefore, accurate characterization of the mud-prone sections is important to describe accurately the architecture of the K76-to-K80 reservoir and to identify key heterogeneities.
In the 156-m-thick gas column, the resistivity signature of both the static- and the dynamic-normalized FMS images is controlled mostly by the highly resistive gas that saturates the sandstones (Figure 8). FMS images in the sheet-sandstone elements are typically of high resistivity, having bright yellow to white static-normalized signatures, in which the gas response masks most geologic data. Therefore, as compared to water-saturated sandstones, it is much more difficult to distinguish different genetic elements in gas-saturated sandstones.
· Regular, meter-scale bedding is visible on the images of sheet sandstones with high-resistivity, high-permeability, carbonaceous-sandstone-rich caps, whether the rocks are gas-saturated (Figure 8a1) or water-saturated (Figure 8a3). However, thickness and distribution of these finer-grained, typically unstructured, more compacted, resistive bed caps are resolved clearly only in the absence of gas saturation. · Low-permeability shale/heterolithic caps can be recognized easily in water-saturated sandstones because they are highly compacted and contain less saline fluid than the sandstones; hence, they are more resistive (Figure 8b3). Only their strongly layered fabric permits their identification in the presence of gas (Figure 8b1). This is because both the gas-saturated sandstones and compacted/cemented shale/heterolithic caps have similar, relatively high resistivities. · Dewatering fabrics--including dish structures and consolidation laminae--are features of high-density turbidite deposits and therefore are observed in cores, but they are not visible in FMS images of gas-saturated sandstones (Figure 8b2). In contrast, they are resolved clearly as impersistent, discordant, bed-parallel features in water-saturated sandstones (Figure 8b4).
In addition, in the gas column in sandstones with either high- or low-permeability caps, static-normalized resistivity commonly is reduced significantly in strata immediately above bed bases (Figure 8a2; notice the duller orange static-normalized FMS images). This pattern is considered to have resulted from slumping of high-density drilling-mud filtrate in strata above the less-permeable bed caps; it highlights the effect that bed caps potentially have on fluid flow in the reservoir.
To develop a realistic exploration model of K76-to-K80 sandstones in the Vøring Basin, a crucial step is to model their sources, paleotransport directions, and distributions. Longitudinal turbidity currents in elongate basins are a well-established concept (Hsu, 1977), yet in limited subsurface data sets, evidence pertaining to sediment sources and paleotransport directions can be equivocal.
Extensive 3-D seismic mapping of the K76-to-K80 section has been undertaken over the PL218 license block area. The 3-D seismic data are characterized by regularly spaced peaks that correlate with high gamma-ray spikes in the limited well data set. The fact has been demonstrated that these high-amplitude gamma-ray peaks are signals from background hemipelagic "fines blankets," deposited during phases of shutdown in sand supply. Therefore, they provide a means to identify and map individual turbidite-sandstone systems throughout the Vøring Basin. The correlations undertaken have been confirmed by biostratigraphic data. Seismic-amplitude maps have been constructed at 20-ms intervals, and isopach maps of these mapped intervals have been generated. Most of the mapped intervals show no seismic amplitude character attributable to variation in facies. In addition, the mapped intervals are broader than 50 km--larger than the mapped area--which demonstrates the scale of the K80 depositional system. However, several isopach-mapped depositional cycles show north-to-northeasterly orientation, parallel to the axis of the Vøring Basin. In addition, the uppermost K80 turbidite-sandstone system has been identified; it is above the top K80 reservoir in the northeastern sector of the PL218 license, but absent in the Luva Discovery to the southwest (Figure 9a). This depositional cycle seems to downlap southward onto the Luva fault block (Figure 9b). This apparent downlap, the absence of this cycle to the south, and evidence that sedimentation was constrained by a northeastward-trending basin axis imply a south-to-southwest sediment-transport direction. This interpretation is supported by regional mapping and by plate reconstructions, which suggest that the K80 system was sourced from East Greenland. The depositional system probably entered the Vøring Basin north of the Gjallar Ridge (Figure 1a) (Bjørnseth et al., 1997). This interpretation is also consistent with the system's thinning westward toward the Gjallar Ridge and eastward toward the Utgard High (Figure 1a), but because wells are few and not in the critical locations, this interpretation is not supported by significant rock data.
The extensive FMS data set acquired in the Luva Discovery well, 6707/10-1, provides a means to assess independently the paleotransport directions of the K76-to-K80 sandstones in the Nyk High area of the Vøring Basin. To determine the paleotransport directions accurately, first the influence of present-day structural dip must be removed; second, all calculations must be made by use of evidence drawn from bed forms that provide reliable data of bed orientation (Figure 7).
Determination of Structural Dip The most reliable means to determine structural dip in the K76-to-K80 section is the use of bedding-surface orientation data from the background hemipelagic "fines blankets," which were deposited during phases of sand-supply shutdown. However, in stratigraphic sections where such deposits are absent--in particular, in the sand-prone upper part of the K80 reservoir--data from fringe elements were used. Bedding surfaces from which structural dip was measured (Figure 7a) were as follows.
· Nonreservoir mud rocks include both diffusely laminated and unstructured background hemipelagic and turbiditic shales (image facies rMl and rMm). With the exception of uncommon bedding surfaces that were deformed by compaction around siderite concretions--which have been excluded from the calculations--these bedding surfaces were most probably deposited flat-lying; they are in thick packages that probably were not deformed by differential compaction above and below sand bodies. · Nonreservoir heterolithics, the low-density turbidite sandstones intercalated with background hemipelagic shales (image facies rHl) in "fines blankets" and fringe elements, are also likely to have been deposited flat-lying. However, these deposits probably are less reliable than nonreservoir mud rocks as indicators of structural dip, because typically they compose thinner intervals and they commonly are intercalated with decimeter-scale, bedded, high-density turbidite sandstones. The sandstones probably have depositional and/or compactional topography which affects the orientations of the mud rocks.
In addition, absence of slump structures and of any evidence of significant erosion in massive/dewatered sheet sandstones with carbonaceous-sandstone caps or shale/heterolithic caps leads to the inference that these sandstones were deposited on a relatively flat basin floor. This conclusion is supported by evaluation of 3-D seismic data, which demonstrates that the sand bodies are laterally extensive, with sheeted geometries that can be mapped across the PL218 license. These sheeted, high-density turbidite sandstones probably have slightly uneven flow tops that resulted from the "freezing" of "attached" debris flows; therefore, they are characterized by a significant degree of azimuth dispersion. Nevertheless, they can be used to test calculations of structural dip made from data based on the "fines blankets" or fringe elements (Figure 7a). Calculations of structural dip made from these data indicate that in the K76-to-K80 section, structural dip is 6 degrees at azimuth 105 degrees (i.e., to the southeastward; Figure 7a). No unconformities have been recognized in sections of background hemipelagic mud rock that bound the K76-to-K80 sand bodies. This interpretation is consistent with that derived from seismic data; therefore, dip of 6 degrees at 105 degrees was applied to calculate paleotransport directions.
Interpretation of Paleotransport Directions High-density sheet sandstones with trough cross-stratified glauconitic-sandstone caps (Figure 4, image facies rSs) are developed throughout the drilled K76-to-K80 reservoir, but they are not of significant volume. Grains of glauconite are not as dense as grains of quartz; consequently, the hydrodynamic properties of glauconite and quartz are quite different. In a high-density turbidity current, segregation of abundant glauconite grains causes the flow to evolve to a traction current of lower density, and structured sandstones are deposited. These sandstones provide valuable bed-form orientation data and are crucial to the understanding of paleotransport directions in the K76-to-K80 reservoir (Figure 7c). The interpreted paleotransport directions are broadly northward; i.e., indicating that the sediment-entry point was to the south of the Luva Discovery (Figure 7c). In detail, bed-form dip directions are eastward at the base of the K80, northeastward at the top of the K80, and they show evidence of dispersion, including apparent reversals in direction of flow in the K80 level (Figure 7c). The observed variations in bed-form orientation are considered to be a consequence of two factors.
· Regional, basin-scale, sediment supply and dispersal interacted with ephemeral, localized sourcing of sandstones. This interaction is predicted by the depositional model of these deposits, and it is consistent with the thin, unattached debris flows and localized glauconitic sandstones, the sources of which may have been from an adjacent shelf (Figure 3b). · Turbidity currents were deflected around localized features of high relief that resulted from compensation stacking of adjacent, sheetlike sand bodies. This may explain the apparent reversals in paleotransport direction, which are observed at several stratigraphic levels in the K76-to-K80 section (Figure 7c).
The broad northeasterly to easterly paleotransport directions implied by FMS data contradict interpretations made from 3-D seismic data. They imply that the source of these basin-floor sediment-gravity flows was south of the Gjallar Ridge. If this inference is correct, the models for sand supply and dispersal in the Vøring Basin must be reassessed.
The conflicting evidence of sediment-transport directions drawn from borehole-image interpretation and from seismic mapping have not been resolved. Both data sets permit alternative interpretations. The thicknesses and stratal relationships observed in seismic imagery could reflect simply the filling of topography of a preexistent basin, independent of sediment-transport directions. Alternatively, although the observed southwesterly pinchout of the uppermost K80 sand body (Figure 9a) may provide evidence of paleotransport directions to the south, this sand body simply may have filled a depositional low. Similarly, the sediment-transport directions inferred from borehole-image data merit low confidence. This possibility was considered: The northerly dipping, structured bed forms were deposited by turbidity currents that were reflected, and hence reversed, by a major structural high south of the Luva Discovery. This hypothesis was rejected, in the absence of any collateral evidence of such a high. However, analogues from outcrops show that flow directions recorded in waning-flow ripples commonly are deflected from the main transport direction of the overall system (Karl et al., 1986; Shanmugam et al., 1993). This fact could account for the disparity between borehole-image data and seismic data, as could local sourcing of glauconite grains from adjacent structural highs. (The latter explanation implies that the glauconite sandstones may not be representative of the sand complex.) However, interpretations of a paleoflow to the north are supported by the fact that background-hemipelagic mud rocks both below and above the K76-to-K80 reservoir section--i.e., separated by approximately 1000 m of sandstones--have identical, low-angle (2 degrees to 3 degrees) northerly sedimentary dip. These mud rocks, inclined at low angles, are inferred to have been deposited on a paleoslope; the observed paleoflow directions could have been downslope, or transverse or oblique to such a slope. This line of reasoning leads to the hypothesis that sediment dispersion in the Vøring Basin was controlled by syndepositional intrabasinal tectonism that generated local paleoslopes.
The principal conclusion of this evaluation is that high-resolution resistivity images provide valuable data that can be used to improve geological models of petroleum reservoirs in basin-floor sediment-gravity-flow deposits. Detailed evaluation of FMS data from a K76-to-K80 sand-rich turbidite complex, the Luva Discovery well, integrated with data from cores and open-hole logs, resulted in three secondary conclusions.
· Where core control is absent, FMS data and data from open-hole logs are a means to accurately identify and quantify the distribution of bed-scale disparities in permeability. Heterogeneities in dewatered high-density turbidite beds range from amalgamated sandstones with high vertical permeability through glauconitic, carbonaceous, and mudclast-rich bed tops deposited by waning turbidity flows, to caps of background-hemipelagic shale and low-density turbidite heterolithic deposits with low vertical permeability. These three sheet sandstone bed types have very similar open-hole log responses, but they are distinguished easily by analysis of resistivity-image data. · High gas saturations have a significant effect on resolution of geologic features by resistivity images. This makes identification of key bed-scale heterogeneities more difficult, because gas-saturated sandstones and compacted bed caps have similar high resistivities. However, identification is possible. In addition, relatively low resistivities commonly are observed in sandstones immediately above the low-permeability bed caps. This is attributed to slumping of high-density drilling-mud filtrate and reduction of resistivity. · Orientations of low-density, trough cross-stratified, highly glauconitic bed caps provide evidence of paleotransport directions to the east and northeast. These inferred directions of current flow oppose those interpreted from pinch-out of the uppermost K80 sand body toward the southwest. The K80 sand body contains downlap surfaces, interpreted with uncertainty from a subregional 3-D seismic data set. The conflict of evidence is unresolved but has forced reassessment of the regional models for sand input and distribution.
The authors extend their thanks to BP Norge AS and the PL218 license partners Norsk Conoco AS, Esso Exploration and Production Norway AS, and Statoil ASA for giving permission to publish this work. Dr. Peter Haughton provided invaluable input for this paper. Badley Ashton & Associates Ltd. and, in particular, Gerry Hyde, who drafted the figures, are thanked for their assistance in preparation of this paper.
Bjørnseth, H.M., S.M. Grant, E.K. Hansen, J.R. Hossack, G.D. Roberts, and M. Thompson, 1997, Structural evolution of the Vøring Basin, Norway, during the Late Cretaceous and Palaeogene: Journal of the Geological Society (London), v. 154, p. 559-563. Hsu, K., 1977, Studies of Ventura Field, California, I: Facies geometry and genesis of Lower Pliocene turbidites: AAPG Bulletin, v. 61, p. 137-168. Karl, H.A., D.A. Cacchione, and P.R. Carlson, 1986, Internal wave currents as a mechanism to account for large sand waves in Navarinsky Canyon head, Bering Sea: Journal of Sedimentary Petrology, v. 56, p. 706-714. Kneller, B.C., and M.J. Branney, 1995, Sustained high-density turbidity currents and the deposition of thick massive sands: Sedimentology, v. 42, p. 607-616. Lowe, D.R., 1982, Sediment gravity flows: II. Depositional models with special reference to the deposits of high-density turbidity currents: Journal of Sedimentary Petrology, v. 52, p. 279-297. Lundin, E.R., and A.G. Dore, 1997, A tectonic model for the Norwegian passive margin with implications for the NE Atlantic: Early Cretaceous to break-up: Journal of the Geological Society (London), v. 154, p. 545-550. Mutti, E., and W.R. Normark, 1987, Comparing examples of modern and ancient turbidite systems: Problems and concepts, in J.K. Leggett and G.G. Zuffa, eds., Marine clastic sedimentology: Concepts and case studies: London, Graham and Trotman, p. 1-38. Shanmugam, G., T.D. Spalding, and D.H. Rofheart, 1993, Process sedimentology and reservoir quality of deep-marine bottom-current reworked sands (sandy contourites): An example from the Gulf of Mexico: AAPG Bulletin, v. 77, p. 1241-1259. Walker, I.M., K.A. Berry, J.R. Bruce, I. Bystøl, and J.H. Snow, 1997, Structural modelling of regional depth profiles in the Vøring Basin: Implications for the structural and stratigraphic development of the Norwegian passive margin: Journal of the Geological Society (London), v. 154, p. 537-554. |
 Figure
1. (a) Regional map of V
Figure
1. (a) Regional map of V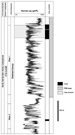 Figure
2. Stratigraphy of the Upper Cretaceous K76-to-K80 reservoir section in
the Luva Discovery well 6707/10-1. Also illustrated are positions of the
gas column and parts of the stratigraphic sequence recorded by the
Formation MicroScanner (FMS) and from cores.
Figure
2. Stratigraphy of the Upper Cretaceous K76-to-K80 reservoir section in
the Luva Discovery well 6707/10-1. Also illustrated are positions of the
gas column and parts of the stratigraphic sequence recorded by the
Formation MicroScanner (FMS) and from cores.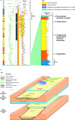 Figure
3. (a) Open-hole logs illustrating the stacking patterns of sandstones
and key genetic depositional elements within the Nise 1 sand body.
Figure
3. (a) Open-hole logs illustrating the stacking patterns of sandstones
and key genetic depositional elements within the Nise 1 sand body. Figure
4. (a) Cartoon showing comparison of the nongenetic core lithotype and
the genetic-image facies schemes applied to K76-to-K80 sheet sandstones
in Luva Discovery well 6707/10-1.
Figure
4. (a) Cartoon showing comparison of the nongenetic core lithotype and
the genetic-image facies schemes applied to K76-to-K80 sheet sandstones
in Luva Discovery well 6707/10-1. Figure
5. (a) Open-hole log, static- and dynamic-normalized FMS and core data
that illustrate key characteristics of amalgamated sheet sandstones.
Figure
5. (a) Open-hole log, static- and dynamic-normalized FMS and core data
that illustrate key characteristics of amalgamated sheet sandstones.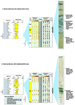 Figure
6. (a) Open-hole log, static- and dynamic-normalized FMS and core data
that illustrate key characteristics of sheet sandstones with mud-prone
and mudclast-rich "attached" debris-flow bed tops. (b) Sheet sandstones
with shale/heterolithic-deposit caps, in the K76-to-K80 reservoir
section.
Figure
6. (a) Open-hole log, static- and dynamic-normalized FMS and core data
that illustrate key characteristics of sheet sandstones with mud-prone
and mudclast-rich "attached" debris-flow bed tops. (b) Sheet sandstones
with shale/heterolithic-deposit caps, in the K76-to-K80 reservoir
section.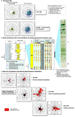 Figure
7. (a) Stereonets of background-hemipelagic-fines blankets and of sheet
sandstones. Stereonets plotted as true dips and corrected for structural
tilt of 6 degrees at 105 degreesS.
Figure
7. (a) Stereonets of background-hemipelagic-fines blankets and of sheet
sandstones. Stereonets plotted as true dips and corrected for structural
tilt of 6 degrees at 105 degreesS. Figure 8. Static- and dynamic-normalized FMS
images in the K76-to-K80 reservoir section.
Figure 8. Static- and dynamic-normalized FMS
images in the K76-to-K80 reservoir section.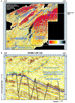 Figure
9. (a) Seismic-amplitude map of the uppermost K80 sand body,
illustrating the distribution of sandstone and inferred sand-dispersal
pattern in the Luva structure.
Figure
9. (a) Seismic-amplitude map of the uppermost K80 sand body,
illustrating the distribution of sandstone and inferred sand-dispersal
pattern in the Luva structure.