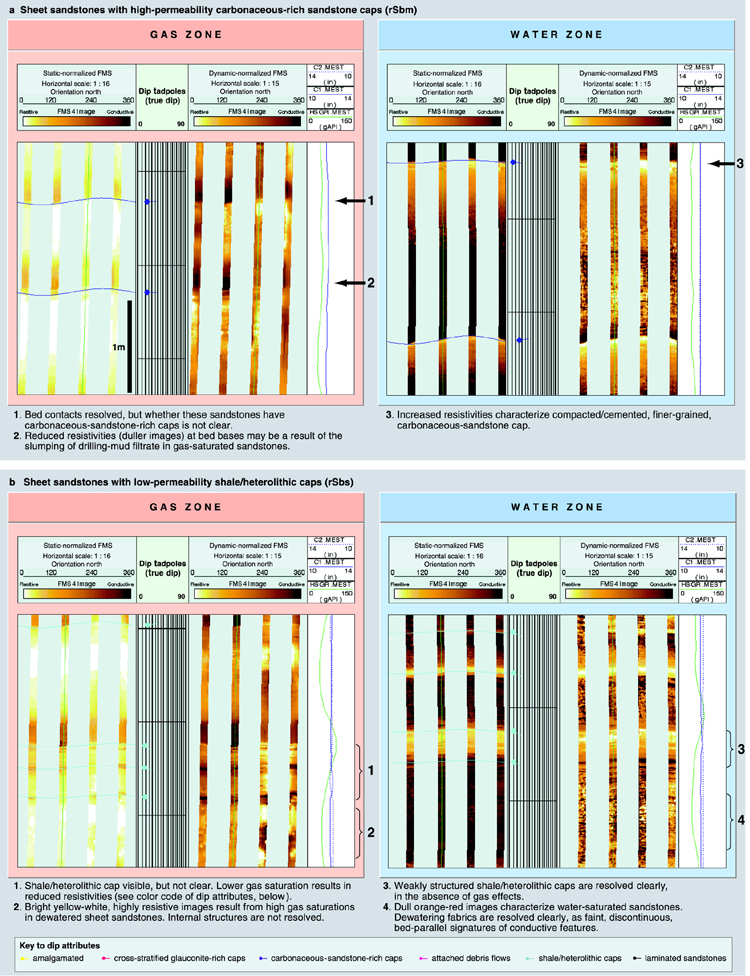
Figure 8. Static- and dynamic-normalized FMS images in the K76-to-K80 reservoir section. Illustration of differences in effects of gas saturation and water saturation in (a) sheet sandstones with caps of high-permeability carbonaceous-rich sandstone and (b) sheet sandstones with caps of low-permeability shale and heterolithic deposits.