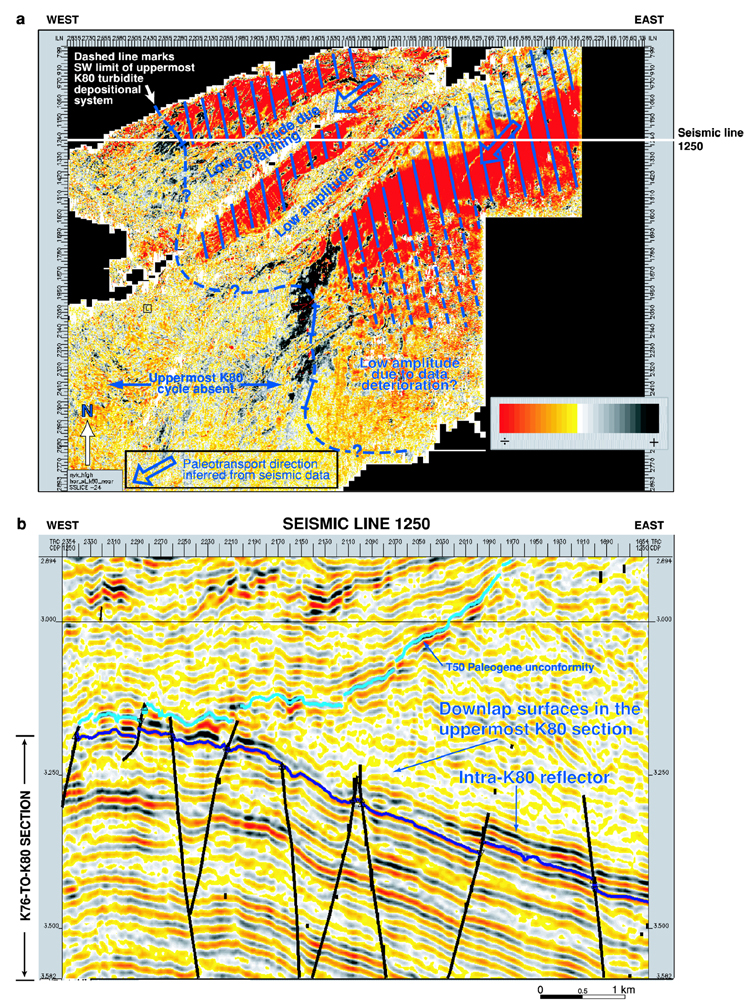
Figure 9. (a) Seismic-amplitude map of the uppermost K80 sand body, illustrating the distribution of sandstone and inferred sand-dispersal pattern in the Luva structure. Lower left-hand quadrant: "L" shows site of Luva discovery. Lower right-hand quadrant: Red-to-gray array shows variation in seismic amplitude. Horizontal scale shown at lower right corner, Figure 9b. (b) Cross section through seismic line 1250, showing the inferred downlap surfaces in the K76-to-K80 reservoir section. Vertical scale is two-way time.