![]() Click for relatively high-resolution PDF version of figures and
table in view of printing.
Click for relatively high-resolution PDF version of figures and
table in view of printing.
IDENTIFICATION AND CHARACTERIZATION OF RESERVOIRS AND SEALS IN THE VICKSBURG FORMATION, TCB FIELD, KLEBERG COUNTY, TEXAS
Zuhair Al-Shaieb, Jim Puckette, Jay Patchett, Phebe Deyhim, Han Li, Amy
Close, and Ryan Birkenfeld, Oklahoma State University
Search and Discovery Article #20004 (2000)
Adaptation for online presentation from a report of the same title and by the same authors prepared for the Gas Research Institute, GRI Contract No. 5097-260-3777, GRI Project Manager, Richard A. Parker, July 2000. This article is published with the kind permission of GRI, which holds the copyright to it. Please refer to authors’ Acknowledgments.
Low-resistivity/low-contrast (LR/LC) intervals in the Vicksburg Formation in TCB field of South Texas are composed of silty, very fine-grained reservoirs less than 2 ft thick separated by seals. Porosity in these sandstones is highly variable and permeability is reduced significantly because of calcite, silica, and clay minerals cements. Upper Vicksburg and Lower Vicksburg reservoirs, respectively, formed as highstand and lowstand systems tract sediments.
The Vicksburg Formation in TCB field is overpressured and compartmentalized, and Upper and Lower Vicksburg reservoirs are the two major compartments identified in this study. The overpressured Vicksburg is separated from the overlying Frio by a 1st order seal. The Upper and Lower Vicksburg compartments are separated from each other by 2nd order seals. Intra-compartment seals subdivide the major compartment into smaller ones.
On micro-imaging logs, low-resistivity Vicksburg shale and claystone appear as dark brown to gray bands on the image. White color bands represent rocks with the highest relative resistivity--calcite- and/or silica-cemented sandstone with low porosity (<8%) and permeability (<0.003 md). Yellow bands represent the primary reservoir sandstone facies in the LR/LC interval--sandstone with high porosity (average 21%) and relatively high permeability (average 0.16 md). Orange bands are sandstone, with abundant authigenic clay, showing high porosity (average 18%) but relatively low permeability (0.06 md).
Capillary-pressure measurements may be used to calibrate imaging logs in distinguishing reservoirs from seal intervals. The yellow bands exhibit low displacement pressures (Pd), whereas mercury-injection curves for samples from orange and yellow zones commonly indicate both macro- and micro-pores. White chromatic bands that form intra-formation seals, show high injection, displacement pressures and sealing capacity.
Seal zones may be identified using fluid-inclusion stratigraphy (FIS). Intra-reservoir seals usually contain abundant fluid inclusions, due to significant cementation.
Integration of high-resolution and micro-imaging logs, capillary-pressure data and fluid-inclusion stratigraphy may be the most suitable method in recognizing reservoirs and seal intervals. Micro-imaging, by allowing the detection of diagenetic bands and lithologic changes, is expected to be useful in characterization of compartmentalized conventional reservoirs. Also, micro-imaging is also expected to be helpful in determining seal and reservoir properties of faults and fractures.
 Figure 1. Location of the TCB Field in Kleberg and Jim Wells Counties, Texas.


Click here to view animation of this image with and without vertical exaggeration.

Click here to see animation of figures 6, 7, and 8.

Click here to see animation of figures 6, 7, and 8.

Click here to see animation of figures 6, 7, and 8.
![]() Figure 10. Composition of the 9900-ft sandstone plotted on QRF diagrams (Folk, 1974).
Figure 10. Composition of the 9900-ft sandstone plotted on QRF diagrams (Folk, 1974).
Click here to see animation of A and B.
Click here to see animation of A and B.
Click here to see animation of A and B.


Click here to see animation of A and B.
Click here to see animation of A and B.

Click here to see animation of A: (PPL & CPL).
 Figure 20. SEM micrograph of authigenic illite and chlorite, Vicksburg
sandstone, TCB Field.
Figure 20. SEM micrograph of authigenic illite and chlorite, Vicksburg
sandstone, TCB Field.
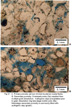

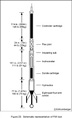 Figure 23. Schematic representation of FMI tool.


 Figure 38. Photomicroscopy of fluorescing petroleum inclusions.
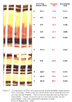
 Figure
39. Changes in
relative amounts of selected ionic species and ratios of ionic species.
Peak intensity (relative amounts of species) increases to the right. Noticeable changes between responses in Frio and Vicksburg
sections suggest different sources and /or migration pathways on either side of
the Vicksburg seal. Frio fluid
inclusions are relatively enriched in aromatics (Arm) and naphthalene (Nap).
Vicksburg inclusions are enriched in paraffins (Par), in particular, CH4,
C2H6, and C5-C13 species, as well as
benzene and toluene.
Figure
39. Changes in
relative amounts of selected ionic species and ratios of ionic species.
Peak intensity (relative amounts of species) increases to the right. Noticeable changes between responses in Frio and Vicksburg
sections suggest different sources and /or migration pathways on either side of
the Vicksburg seal. Frio fluid
inclusions are relatively enriched in aromatics (Arm) and naphthalene (Nap).
Vicksburg inclusions are enriched in paraffins (Par), in particular, CH4,
C2H6, and C5-C13 species, as well as
benzene and toluene.


Contents
Stratigraphy and Depositional setting
Petrology and Petrography of Reservoir and Seal Facies
Diagenetic Constituents and Features
Identification of Reservoirs and seals Using FMI and Other High Resolution Wire-Line Logs
Chromatic Variation in LR/LC Sandstones
Capillary Pressure, Sealing Capacity and Pore Structure
Relationship of Fluid-Inclusion Stratigraphy to Formation Pressure
Identifying Fault Seals Using Micro-Imaging Logs
Characterization of compartmentalized natural gas reservoirs in the Vicksburg Formation is the primary objective of this report. Connobly the overpressured, low-resistivity/low-contrast (LR/LC) reservoirs have been bypassed because their detection and evaluation were difficult with wireline logging technology that prevailed until rather recently. The difficulty of identifying reservoir and seal facies is further compounded in LR/LC intervals. The development of high-resolution logging tools has greatly enhanced their characterization. These intervals are becoming increasingly important exploration targets in mature basins.
The 9900-ft sandstone of the Vicksburg Formation, selected for this investigation, is composed of thinly bedded and interlaminated sandstone and shale and is an example of a low-resistivity/low-contrast (LR/LC) sandstone reservoir. Conventional wireline signatures are usually suppressed, and therefore their utilization as interpretation tools becomes less effective. Reserve calculations and economic evaluation are usually based on net-pay calculations derived from wireline log measurements. In many instances, wireline logs are the only tool available to perform this essential task. The availability of high-resolution resistivity and porosity tools and formation micro-imaging logs has greatly improved interpretation of thinly bedded rocks.
The cores used in this project were calibrated to high-resolution and micro-imaging logs. Micro-imaging is used to identify sedimentary bedding and diagenetic banding less than one inch thick. Chromatic variations which reflect resistivities of the formation can be attributed to changes of lithofacies and diagenetic patterns. Accurately measuring the relative thickness of cemented and porous beds in LR/LC zones can improve net-reservoir/net-pay calculations and economic evaluation.
In addition to formation micro-imaging, various methods and techniques were used here in the identification and characterization of compartments and seals. They are fluid-inclusion stratigraphy (FIS), formation-pressure measurements, and capillary-pressure measurements. The emphasis on characterization processes was two fold:
-
To examine the spatial relationship between reservoir and seal intervals within overpressured compartments, and
-
To provide a specific petrophysical and capillary-pressure-sealing-capacity parameter for intra-compartment seals.
A LR/LC gas-producing interval was examined in TCB field in Kleberg County, Texas (Figure 1). This interval was chosen because of data availability and its economic significance. TCB field has produced in excess of 172 billion cubic feet (BCF) gas and 4 million barrels of liquids (MMBL) from the Vicksburg formation since 1942 (Petroleum Information/Dwights, 1999; International Oil Scouts Association, 1997; Taylor and Al-Shaieb, 1986). LR/LC Vicksburg reservoirs within TCB field had a cumulative production in excess of 20.4 BCF and 451 thousand barrels of liquids before field consolidation in 1993 (P.I./Dwights, 1999; International Oil Scouts Association, 1997.). TCB field is part of the greater Vicksburg trend (Figure 2) that has a cumulative production of over 5.0 trillion cubic feet (TCF) gas and 320 MMBL (Combes, 1993). LR/LC reservoirs are a significant contributor to this production and are becoming increasingly important as exploration targets. As a result of the difficulty interpreting these economically important reservoirs, Oryx Energy Company (now Kerr McGee Corporation) provided various data, including cores, wireline logs, and core analyses, from the LR/LC "9900-ft" sandstone for this study. While this work focuses on TCB field, the results may improve evaluation strategies of LR/LC reservoirs along the Vicksburg trend and elsewhere.
In addition to examining LR/LC reservoirs, Oryx provided an additional five cores from conventional Vicksburg reservoirs in TCB field. Integration of mapping, sedimentologic, petrographic, petrophysical, and production data from all reservoirs contributed to the interpretations in this report. The techniques presented should have widespread application in rocks where recognizing reservoir heterogeneity and delineating it are important.
A primary objective of the GRI project is to formulate improved techniques to evaluate LR/LC hydrocarbon-bearing rocks in the U.S. Gulf Coast. The evaluation of the LR/LC gas-bearing interval of this study using conventional petrophysical techniques is extremely difficult due to the resolution of these tools and the abundance of clay minerals. The specific objectives include:
-
Calibration of cores to high-resolution wireline logs and formation micro-images,
-
Identification of lithologic, petrographic, and petrophysical parameters for each of the micro-imager chromatic zones,
-
Differentiation between reservoir and seal zones using fluid-inclusion stratigraphy and micro-imaging,
-
Determination of seal capacity of intra-compartmentalized seals using capillary-pressure data.
The cored LR/LC intervals from two wells were correlated to the various wireline logs, including high-resolution gamma-ray, resistivity and porosity, and micro-imaging logs. They were sampled for thin-section petrography, X-ray diffractometry, scanning-electron microscopy, and capillary-pressure measurements. In addition, core-plug data on porosity, permeability, grain density, and fluid saturation were also available. These data were augmented with additional core-plug samples that were selected on the basis of wireline log to core correlation.
The presence of thin, highly cemented sandstone and shale beds in the cored intervals permitted a close correlation (within 1 ft) of cores to the high-resolution logs. The resolving capabilities of micro-imaging logs allowed their correlation to cores on an inch scale. High-accuracy correlation facilitated sampling of the core and characterization of the rocks representing various chromatic bands to micro-imaging logs.
All other cored intervals were also calibrated to wireline logs. These cores were described and sampled for detailed petrographic and mineralogic analysis.
Fluid-inclusion stratigraphy (FIS) in conjunction with available pressure data were utilized to investigate compartmentalization and seals of the Vicksburg Formation.
STRATIGRAPHY AND DEPOSITIONAL SETTING
The Oligocene Vicksburg Formation (Figure 3) is interpreted as a series of prograding deltas that are separated by marine transgressions (Combes, 1993; Coleman, 1990; Taylor and Al-Shaieb, 1986). The Vicksburg overlies the Eocene Jackson Shale that provided an unstable shelf margin for Vicksburg deposition. Sediment loading on the undercompacted Jackson mud caused large-scale slope failure along listric glide “planes.” Deformation of the Jackson into ridges and diapirs, along with regional extension, generated accommodation space for Vicksburg sediment accumulation. Rollover anticlines were generated and segmented by synthetic and antithetic faults (Figure 4). Vicksburg depositional style was influenced by structure as thicker sand sequences accumulated on the downthrown sides of faults. These sequences thinned over the crests of the anticlines and distally into the basin (Figure 4).
Major sand accumulations in the Lower and Upper Vicksburg reservoirs (Figure 5) represent fluvial-deltaic progradation depositional facies. The 9900-ft intervals show abundant evidence of marine influence, such as fossils, trace fossils, and glauconite. This interval represents the transgressive phase of the Vicksburg, interpreted to have been deposited in a shallow-marine, shoreface environment (Figures 6 and 7).
Generalized seismic stratigraphy indicates the Lower Vicksburg section (10250 - 11800 ft sandstone zones) represents a progradational wedge deposited in a lowstand systems tract (, Coleman,1990; Combes 1993; Al-Shaieb et al., 2000). Basic structural timing of the movement along the growth fault can be determined from seismic data. A visible thickening of sandstone and shale interbeds is evident in the Vicksburg 9400 - 9900-ft intervals, suggesting that movement along the fault was greatest during this time (Figure 8). The 9400 - 9900-ft interval is interpreted as a transgressive systems tract (Al-Shaieb et al., 2000). The Upper Vicksburg Wilson - 9000-ft sandstones are interpreted as sheet sands deposited in a prograding highstand systems tract. They are represented by continuous high amplitude beds on the seismic cross-section (Figure 9).
The thick shale intervals separating sandstones are interpreted as flooding events. The intensity of progradation, subsidence, and marine reworking influenced sediment accumulation and ultimately reservoir geometry and distribution. LR/LC intervals, such as the 9900-ft sandstone, may be interpreted as transgressive lower shoreface deposits. These interbedded and interlaminated sandstones and shales contain a variety of trace fossils, including Paleophycus, Planolites, Skolithos, Teichichnus, and Zoophycos that are indicative of a shallow-marine setting. The distribution and geometry of individual reservoirs within the 9900-ft zone were difficult to establish, but the total interval thickness was mapped (Figure 9). It thickens toward the fault and shows a marked increase in sandstone along the fault trend.
PETROLOGY AND PETROGRAPHY OF RESERVOIR AND SEAL FACIES
Oryx (Kerr McGee) cored the 9900-ft zone in two wells: A.T. Canales #81 and A.T. Canales #85. The cores were correlated and calibrated to Schlumberger’s Formation Micro-ImagerTM (FMI) logs and High-Resolution-Array Induction, Density-Neutron Gamma-Ray and Spontaneous-Potential logs. Geologic features, such as bedding planes, flowage structures, burrows, and cross beds, were identified in the core and on the FMI images. Chromatic changes associated with these features allowed an inch-scale calibration of the core to the FMI. Calcite- and silica-cemented zones identified on the FMI were correlated to clean, low-porosity zones on the High-Resolution Gamma-Ray and Density-Neutron logs.
The cores were described and sampled for thin-section, X-ray, and SEM analyses. Thin-section porosity was correlated to porosity measurements from logs. Detrital and diagenetic constituents were determined by thin-section analysis. These sections provided data to augment the macroscopic examination of the cores. Clay minerals were identified using powder X-ray diffraction and SEM analysis.
Classification
The major detrital constituents in the 9900-ft Vicksburg sandtones are quartz, feldspar, chert, and volcanic and metamorphic rock fragments. The sandstones were classified on the basis of the relative percentages of these grains using the Folk (1974) (QRF) ternary diagram (Figure 10). In general, sublitharenite, feldspathic litharenite, subarkose and lithic arkose were the major lithologies determined from individual thin-sections. The average compositions for both cores plotted as feldspathic litharenites. These lithologies represent the present (post-dissolution) composition. Restoring dissolved feldspar and rock fragments would shift the original composition plots toward the base of the feldspathic litharenite and lithic arkose fields.
The 9900-ft zone is primarily silty, very-fine grained sandstone and shale. The sandstones are moderately sorted. Quartz is the major constituent, while feldspar and sedimentary and volcanic rock fragments are present in various amounts. Minor constituents include chert, metamorphic rock fragments, muscovite, biotite, glauconite, zircon, pyrite, tourmaline, and skeletal fragments.
The most abundant detrital grain in the Vicksburg sandstones is quartz (Figure 11). Most grains are monocrystalline and exhibit uniform extinction. Polycrystalline quartz, present in minor amounts, likely represents a metamorphic source. Fluid and mineral inclusions are present in some monocrystalline grains.
Plagioclase feldspar is the second most abundant detrital grain. Plagioclase grains are easily identified by their albite twinning (Figure 11).
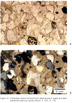
Rock fragments are a common constituent in the Vicksburg sandstones. Volcanic fragments are abundant (6-10% of the total rock) and easily identified by the randomly oriented plagioclase phenocrysts in their microphyric texture (Figure 12). Sericitization and devitrification of these grains are common, making grain identification more difficult. Sedimentary-rock fragments are present in various amounts. Argillaceous fragments are common in some samples, while chert and carbonate grains are minor constituents (Figure 13). Metamorphic-rock fragments occur as a minor constituent.
Glauconite is a common secondary constituent. It occurs as rounded grains that are typically green in plane-polarized light (Figure 12). It is green with moderate birefringence in cross-polarized light.
Muscovite and biotite were widespread accessory grains in both cores. Muscovite was identified by its distinct morphology, color, and birefringence. Biotite was recognized by its pleochroism, color, and extinction.
Pyrite, zircon, tourmaline, and skeletal grains are all present in minor amounts. The dominant skeletal grains are forams, which occur as several grains per thin section. Detrital clay is present as true matrix or pseudomatrix (Figure 14). The latter was formed by ductile deformation of softer grains, such as argillaceous and volcanic rock fragments.
Diagenetic Constituents and Features
Sandstones not cemented in early diagenesis commonly show signs of compaction. Flexible and soft components were ductily deformed. Argillaceous and volcanic rock fragments flowed between quartz grains forming pseudomatrix. Elongate muscovite and biotite grains were bent or fractured by contact with harder quartz and feldspar grains (Figure 15). Chemical diagenesis has significantly modified the Vicksburg sandstones, which have experienced several episodes of cementation and dissolution. Calcite is the dominant cement, but silica cement is significant in some areas.
Calcite is the major cement and completely occludes porosity in some sandstones. It varies from being isolated patches to widespread zones. Calcite replaces quartz grains in the latter area and forms poikilotopic texture where quartz grains "float" in calcite cement (Figure 16). Zones cemented by calcite are identified as white color bands on FMI logs (Figure 17). Siderite is a minor constituent and occurs as subhedral crystals.
Silica cement as syntaxial quartz overgrowth is common (Figure 18). The overgrowth is easily recognized when it is separated from the detrital grain by a clay "dust rim." In some cases the boundaries between the overgrowths and detrital grains are not distinct, but the cement contains fewer inclusions than the detrital grain. Silica cement is more prevalent in cleaner sandstones with lesser amounts of clays. In these, advanced stages of overgrowth occur. Silica-cemented zones appear as white color bands on the FMI logs (Figure 17).
Authigenic clays in the 9900-ft interval are mixed-layer smectite-illite, illite, kaolinite, and chlorite, with mixed layer smectite-illite being the most abundant. It is identified by its characteristic peaks on X-ray diffractograms.. SEM photomicrographs reveal that mixed-layer smectite-illite is pore-lining and bridging. Kaolinite is the second most abundant clay. It is identified in thin-section by its crystal morphology, color, and low birefringence. Kaolinite was also identified using X-ray diffraction and SEM (Figure 19). Authigenic illite occurs as highly birefringent crystals that line pores. It is present throughout the core, but is not abundant. Chlorite is a minor authigenic constituent that was identified by X-ray and SEM (Figure 20). Intervals with abundant clay minerals and lower resistivity are identified as darker yellow and orange bands on the FMI logs (Figure 17).
Pyrite is a minor constituent in all thin-sections. It partially replaces altered rock fragments and skeletal grains.
Both primary porosity and secondary porosity are preserved in the 9900-ft sandstone. Volumetrically, secondary porosity is much more significant than primary. Primary porosity is thought to have provided the avenues for pore-fluid migration, which resulted in partial or complete dissolution of metastable constituents to generate secondary porosity. Porosity estimated from thin-section is consistently lower than porosity measured by core-plug analyses. This discrepancy may be due in part to underestimating microporosity between clays or in partially dissolved grains. Core-plug porosity is consistent with density-porosity measurements in zones within the logging tool's resolution capability (Al-Shaieb et al., 1998).
Color variation in the FMI tool indicates porosity on a one-inch scale. Yellow and orange color bands consistently indicated porosity exceeding 18%. White band porosity values are less than 10% (Figure 17).
Primary Porosity
Intergranular porosity is the form of primary porosity preserved in these rocks. As a result of compaction and cementation, primary porosity is present in only trace amounts. It typically occurs as small (.01-.03 mm diameter) planar-sided pores bordered by syntaxial quartz overgrowths (Figure 21). In cleaner sandstones, near-total destruction of primary porosity is common.
Secondary Porosity
Secondary porosity is the volumetrically significant porosity in the 9900-ft sandstone. It can be attributed to the partial and/or complete dissolution of metastable siliceous grains. Pore morphologies range from partial leaching of grains to total grain dissolution and oversized intergranular porosity (Figure 22).
Plagioclase feldspar dissolution accounts for the largest percentage of secondary porosity. Leaching of volcanic rock fragments also generated significant secondary porosity. Lesser amounts of porosity were formed by the dissolution of other constituents including glauconite, argillaceous rock fragments, and matrix.
Feldspar and volcanic rock fragments exhibit various stages of dissolution. Initially, leaching formed intragranular microporosity. As dissolution progressed, the grains were skeletonized and finally totally consumed.
Moldic porosity with near-circular shape suggests the total dissolution of rounded rock fragments or glauconite grains. Shrinkage porosity around glauconite may represent the initial stage of the latter form of moldic porosity. Uncommon oversized pores appear to be the result of multiple grain dissolution.
Microporosity is an important feature in the 9900-ft sandstone. It developed within partially dissolved grains and/or where available pore space was filled with authigenic clays. These intercrystalline micropores generally have small pore-throat radii (less than 0.5 micrometers) and significantly reduce permeability (Al-Shaieb, et al., 1998).
IDENTIFICATION OF RESERVOIRS AND SEALS USING FMI AND OTHER HIGH RESOLUTION WIRE-LINE LOGS
Formation micro-imaging tool and high-resolution wireline logs were used to characterize reservoirs and seals. Micro-imaging provides the resolution of bed thickness and other lithologic features, such as sedimentary structures, burrows, and trace fossils and fault zones. High-resolution density logs accurately calculate porosity in zones approximately 1.5 ft thick, while high-resolution resistivity can determine bed boundaries to thickness of approximately one foot.
Micro-imaging tools measure micro-conductivity using closely spaced button electrodes mounted on pads. Each pad contains 24 sensor electrodes, resulting in measurement resolution of 0.2 to 0.3 inches. These tools typically have 6-8 articulating pads mounted on independent arms (Figure 23). This design allows relatively free movement to improve electrode to formation contact (Halliburton, 1997; Schlumberger, 1992). Like other micro-resistivity tools, micro-imaging tools are designed to be run in conductive, water-based mud. The depth of investigation for micro-imaging tools is up to 30 inches. When used as dipmeters or high-resolution tools for sedimentologic, vug, or fracture analysis, their normal investigation depths are typically a few inches. This shallow depth of investigation limits the resistivity measurements to the flushed zone (Rxo). As a result, formation fluids have minor effect on micro-imaging tools, and the recorded resistivity measurements reflect only rock properties. Variations in current recorded by micro-imaging tools are converted to synthetic color images. Dark colors reflect high micro-conductivity (low resistivity), while light colors reflect low micro-conductivity (high resistivity) zones.
Most micro-images are viewed in two forms, static and dynamic. The static view has a fixed resistivity scale over the logged interval so that beds with the same color shade have the same resistivity. The dynamic view presentation uses a sliding resistivity scale that is applied at 1-ft intervals. This view enhances the visibility of small details by maximizing the contrast between features. The static view allows the comparison of resistivity over depth. When these resistivity values are core-calibrated, the micro-imager becomes a powerful tool for estimating rock properties.
Chromatic Variation in LR/LC Sandstones
Oryx provided static micro-imager views of the LR/LC intervals that were cored. the 9900-ft sandstone, characterized by lithologic heterogeneity, contains ample bed boundaries to permit image to core correlation on an inch scale. Once correlated, core sampling allowed the detailed analysis of the rocks to determine properties that were responsible for chromatic changes in the images.
Four basic color groups were identified on the micro-images: 1) dark gray to brown, 2) white, 3) yellow, and 4) orange. Mixing and transitional zones also occur.
Dark gray- to brown-colored zones represent clay-rich rocks. Shale and claystone beds and laminae appear as dark bands on the static view. Some dark bands contain sand and/or silt-rich laminae, burrows, and flowage features that are more resistive (lighter color) and contrast with the clay-rich rocks (Figure 24).
White zones represent the least conductive (most resistive) rocks. Thin-section microscopy of this zone indicates resistivity is directly related to abundant cement (Figure 25). Calcite cement is predominant (Figure 25) and nearly occludes porosity in this zone. Less pervasive silica cement gives the same white signature as the calcite. In some white zones, kaolinite is important cement (Figure 26).
Yellow zones are porous sandstones (Figures 25 and 27). They contain authigenic clay but have significant moldic or enlarged moldic porosity that is relatively clay free (Figure 27).
Orange image color is related to the abundance of authigenic clay in this zone (Figures 25 and 28). Clay-free moldic porosity is uncommon. Bound water associated with these clays reduces resistivity and gives the darker (orange) color characteristic of this zone.
Transition and mixed color zones are common in the Vicksburg LR/LC interval. Yellow zones frequently contain white areas that represent patches of cement. Alternatively, white zones contain yellow areas where higher porosity is preserved. Orange patches are common in yellow zones but are noticeably absent in white ones. Commonly, yellow and orange zones have transitional contacts as clay content changes across the sandstone. Although yellow to white transitions also occur, they are less common. Many small-scale depositional, diagenetic, and biogenic features are evident in the gray-brown zones. These features are detected because their higher resistivity contrasts with the adjacent clay-rich beds.
Porosity and capillary-pressure measurements were made of core plugs selected from all chromatic zones examined. In addition, mini-permeameter data were also available for one of the cores. Porosity values from thin-sections were compared to the calculated porosity from density and neutron logs (Table 1). Figure 29 shows high-resolution (20-inch) resistivity and micro-resistivity logs displayed on track 2. The gamma ray signature is shown on track one. The micro-resistivity digital log is derived from one pad of the FMI tool. Resistivity data representing various chromatic zones show similar patterns on high-resolution as well as micro-imager logs in zones thicker than 1.5 feet (block A, Figure 29). On the other hand, resistivity values from thinner beds (<1.5 feet) are more accurately obtained from micro-imager logs. The difference in resistivity patterns illustrated in block B is directly related to the resolution of the two tools.
These clay-rich rocks (shales and claystones) have high porosity (approximately 18%) and low permeability (<0.005 md). If the bed thickness is greater than 1.5 ft, they exhibit normal high gamma-ray log readings that approach the shale base line and low resistivity (0.5-0.7 ohm-m) (Figure 30). Adjacent beds commonly mask gamma-ray signatures of thinner units (<1.0 ft). However, resisitivity signatures respond to the clays and decrease to around 0.5 to 0.7 ohm-m (Figure 30). High-resolution neutron-porosity curves, very responsive to thin shales/claystones, delineate discrete beds about 1.0 ft thick (Figure 30). Because in this area Vicksburg sandstones and shales have similar porosity, the density tool was not effective in identifying clay-rich beds.
Core-plug measurements indicate that highly cemented white zones have low porosity (<8%) and permeability (<0.001 to 0.003 md). White zones >1.5 ft are readily recognized on high-resolution resistivity and porosity curves. Reduced smectite-illite content and low porosity cause a 12 to 18% decrease in neutron porosity from the values measured for adjacent beds. A concurrent decrease in density porosity of 6 to 10% occurs across these zones (Figure 31). White zones in LR/LC intervals are recognized by a marked relative increase in resistivity (3-4 ohm-m). Beds >1.5 ft thick have a deep invasion profile and a spike-like signature in which all resistivity curves have a similar form. Thinner beds (<1.5 ft) have a similar spike-like signature, but the increase in resistivity is reduced as a result of the tool detecting porosity in adjacent porous beds (Figure 31). Gamma-ray logs indicate that white zones are less radioactive than adjacent sandstones rich in smectite-illite. This "cleaning" effect becomes more apparent if the zone is >1.5 ft thick.
Yellow bands are sandstones with high porosity and relatively high permeability. Core-plug analyses indicate these zones average 21% porosity and 0.16 md permeability. The increased permeability in yellow zones is readily evident in thin-section and scanning-electron microscopy (Figure 21). In thicker zones (>1.5 ft) convergence of neutron and density porosity is also observed; however, neutron-density crossover is rare. Gamma-ray response shows a decrease in radioactivity resulting in a deflection of 45 API units from the shale baseline.
A key to recognizing yellow zones is their invasion profile. Permeability in these sandstones is reflected in a separation between the deep (90, 60, 30, & 20 in.) and shallow (10 in.) resistivity curves. Separation indicates that fresh-water filtrate invasion has increased resistivity adjacent to the wellbore. This profile is most evident where yellow zones are adjacent to shales or claystones (Figure 32). Resistivity curves of clay-rich rocks track one another and commonly appear as one curve. Where a yellow zone is encountered, the resistivity curves separate and the 10-in. curve has the highest value (Figure 32).
Orange zones on the static micro-imager view are sandstones with relatively high porosity but low permeability. Core-plug measurements indicate that orange zones average 18% porosity and 0.06 md permeability. Thin-section and scanning-electron microscopy reveals that porosity in these sandstones is greatly reduced by pore-lining and pore-filling authigenic clays. Log signatures resemble those of yellow zones. Resistivity curves separate as a result of filtrate invasion, but the spread is less than that of yellow zones (Figures 32 and 33). This pattern reflects the reduction of permeability and/or less gas content in this zone.
CAPILLARY PRESSURE, SEALING CAPACITY, AND PORE STRUCTURE
Capillary-pressure curves were used to determine sealing capacity and pore structure. Sealing capacity is defined in terms of (1) the height of a hydrocarbon column the rock will hold without leaking and (2) displacement pressure (Pd). Pore structure evaluation includes size, sorting, and distribution of pore throats. Phillips Petroleum Company provided mercury injection measurements for core samples of sandstones representing all chromatic zones.
White zones have the highest displacement pressures (Pd) (up to 2454 psi) and the greatest gas-column heights (Hpd) (up to 547 ft) (Figure 34). Yellow zones have the lowest displacement pressures (Pd <200 psi) and gas-column heights at displacement pressure that are commonly less than 10 ft (Figure 35). Orange zones display a wide range of displacement pressures and gas-column heights. One orange-zone sample, with microporosity but no apparent moldic porosity (all pores clay filled), shows a displacement pressure of 682 psi and gas-column height of 152 ft. A second orange-zone sample exhibits typical values for displacement (Pd = 171 psi) and gas-column height (38 ft).
Pore-throat size, sorting, and distribution were derived from capillary-pressure curves. The sorting of pore throats reflects the rock's ability to accept hydrocarbons. Pore space in well sorted rocks rapidly saturates with hydrocarbons once a threshold buoyancy pressure is reached. Poorly sorted rocks saturate more slowly and require a pressure increase over a much broader range to obtain the same hydrocarbon saturation (Jennings, 1987). Pore-throat sorting for all samples ranges from moderate to poor. Median pore-throat size ranges from 0.03 to 0.96 micrometers. Median pore-throat size for white zones is less than 0.1 micrometer. Yellow zones have median pore-throat apertures that range from 0.2 to 0.96 micrometers. Orange zones also have a wide range of median pore-throat apertures that reflect the amount of dispersed pore-filling clay. Mercury injection curves for most yellow- and orange-zone samples indicate a bimodal distribution of pore-throat apertures between large moldic pores and clay-grain micropores between authigenic clay particles (Figure 36).
RELATIONSHIP OF FLUID INCLUSION STRATIGRAPHY TO FORMATION PRESSURE
Fluid-inclusion stratigraphy (FIS) involves the complete analysis of volatiles trapped in fluid inclusions, using quadrapole mass analyzers. This includes most geologically important inorganic species in addition to organic species with less than or equal to 13 carbon atoms. The resulting analysis of the petroleum fraction is comparable to the low-molecular weight fraction of a whole-sample gas chromatographic - mass spectrometer (GCM) analysis (Hall, 1999).
Fluid-inclusion stratigraphy was conducted on a total of 403 cuttings and core samples from several wells to produce a nearly continuous composite section from the lower part of the Frio Formation through the Vicksburg and into the Jackson Shale. These samples span a depth interval of 5990-11,616 ft. The goal of this analysis is to: (1) determine the distribution and chemical characteristics of hydrocarbons that have migrated through the section, (2) identify zones of high inclusion frequency that might correlate to 1st and 2nd order seals and (3) establish the impact of these seals on migration paths and oil and gas accumulations. In addition, FIS data were compared with FMI data to determine if cemented bands and reservoirs could be identified at the core scale by using fluid-inclusion frequency distribution.
Several sources were utilized to collect pressure data in TCB field. The sources include calculated pressure data from initial well-head shut-in pressures, wireline bottom-hole pressure tests, wireline formation tests and repeat formation tests.
The overpressured Vicksburg Formation has developed complex sealing patterns that reflect the deposition and compositional parameters of this formation. In general, these seals have a specific functional hierarchy and may be classified in three different categories.
1. 1st Order: These seals are regional and separate normally pressured intervals from overpressured ones.
2. 2nd Order: These seals conform to various stratigraphic boundaries within the overpressured interval and subdivide it into reservoir-sized compartments
3. 3rd Order: These are intra-reservoir seals that are relatively of smaller scale. These seals further subdivide reservoir-sized compartments into smaller intra-reservoir ones and contribute to reservoir heterogeneity.
Figure (37) is pressure-depth profile of the data obtained from TCB field. The 1st order seal separates the normally pressured to slightly overpressured Frio from the overpressured Vicksburg Formation. The 2nd order seals separate the highstand systems tract (Upper Vicksburg) from the lowstand systems tract deposits (Lower Vicksburg). The 3rd order seals are intra-compartment seals. The seals are highly cemented, containing abundant hydrocarbon fluid inclusions (Figure 38). During the cementation episode of a seal, pore fluid commonly was entrapped as inclusions. These inclusions contain a sample of the precipitating fluid and record a history of fluid migration in the basin. These seals are also represented as highest intensities of volatile responses on the FIS pattern (Figure 39).
The FIS analysis indicates a marked change in the total volatile response that coincides with the regional seal separating the Frio and Vicksburg formations (Figure 39). This seal is recognized on the pressure-depth plot by an obvious shift in pressure values around 8000 ft deep (Figure 40). Furthermore, changes in the relative amounts of ionic species suggest different sources or migration pathways for hydrocarbons that filled reservoirs above and below this seal. Frio inclusions are relatively enriched in aromatics and naphthalene, whereas Vicksburg inclusion are enriched in lower molecular weight paraffins, including CH4 and C5 - C13.
FIS analysis of FMI-calibrated core samples indicate that white chromatic zones are richer in volatiles than adjacent orange and yellow zones (Figure 41). This response, which reflects an increase in inclusion frequency in cements, suggests that this tool is useful in identifying seals.
IDENTIFYING FAULT SEALS USING MICRO-IMAGING LOGS
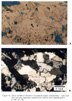
An interesting application of micro-imaging logs is their use in assessing the sealing capacity of faults. Faults in the Gulf Coast region are often considered seals as long as they cut clay-rich rocks and generate "clay smear" seal along the fault surface. Core-calibrated micro-imaging logs were used here to identify faults in both clay- and sand-rich rocks. Many fault surfaces have high resistivity that is expressed as white bands on the static micro-imaging view (Figure 42). Some of these cemented faults were recognized on high-resolution logs by a high-resistivity/low-porosity signature.
These logs identified a series of faults near the base of the Vicksburg section. This suggests that the detachment between the Vicksburg and underlying Jackson Shale is complex, consisting of a series of faults instead of a single glide “plane.”
The micro-imaging log is a valuable tool for identifying reservoir and seal facies. This application is especially important in LR/LC intervals that contain thin beds that are beyond the resolution limits of any other log. The potential applications of micro-imaging logs to reservoir characterization and seal identification are reflected by the following recommendations.
1. Broaden the scope of micro-imaging investigations to encompass more conventional reservoir characterization. The resolving capability of these tools allows the detection of diagenetic bands and lithologic changes in compartmentalized conventional reservoirs. Because previous work with diagenetic seals has shown that these features are typically beyond the resolution limits of most wireline tools, integrating micro-imaging with conventional characterization tools will enhance the geoscientist's ability to recognize these subtle features that may restrict fluid flow in reservoirs.
2. Expand the utilization of micro-imaging logs to include the examination of seal and reservoir properties of fractures and faults. Wells in TCB field cut fractures and faults that were recognized on the micro-resistivity images. Interestingly, these features are commonly cemented in sandstone-rich intervals, suggesting that cemented fault “planes” and/or fractures in sand-rich intervals may act as a barrier to fluid flow. While the importance of clay-smear fault seals has been recognized for years in the Gulf Coast, it is possible that fault cementation may form important lateral seals in the region, especially in older and/or deeper Tertiary reservoirs.
Low-resistivity/low-contrast intervals in the Vicksburg Formation are composed of discrete, thinly bedded (< 2 ft thick) reservoirs that are separated by seals. The reservoir beds are primarily silty, very fine-grained sandstones. Porosity values in the sandstones are highly variable as a result of the presence of calcite, silica, and clay-minerals cements. Permeability is affected by the presence of various cements.
The Vicksburg Formation in TCB is overpressured and compartmentalized. Highstand systems tract reservoirs (Upper Vicksburg) and lowstand systems tract reservoirs (Lower Vicksburg) are the two major compartments identified. The overpressured Vicksburg is separated from the Frio by 1st order seal. The Upper and Lower Vicksburg compartments exhibiting different pressure regimes are separated from each other by 2nd order seals. Intra-compartment seals are 3rd order seals that subdivide the major compartment into smaller ones.
Chromatic zones on micro-imaging logs reflect specific petrographic and petrophysical properties. In the Vicksburg, low-resistivity shale and claystone appear as dark brown to gray bands on the imaging log. White bands represent rocks with the highest relative resistivity. These are calcite- and/or silica-cemented sandstone with low porosity (<8%) and permeability (<0.003 md). Yellow bands represent sandstone with high porosity (average 21%) and higher permeability (average 0.16 md). This is the primary reservoir facies in the LR/LC interval. Orange bands are sandstone with high porosity (average 18%) but lower permeability (0.06 md). These sandstones contain abundant authigenic clay that partitions pores and reduces permeability.
Capillary-pressure measurements can be used to distinguish reservoirs from seal intervals. The yellow chromatic bands on micro-imaging logs exhibit low displacement pressures (Pd) on the capillary-pressure curve. Mercury-injection curves for samples from orange and yellow zones commonly indicate two distinct sizes of pores, macro- and micro-types. On the other hand, white chromatic bands that form intra-formation seals, can be identified by high displacement pressures and sealing capacity.
Seal zones may be identified using fluid-inclusion stratigraphy (FIS). Intra-reservoir seals usually contain abundant fluid inclusions, both aqueous and hydrocarbon due to significant cementation. Regional seals may be recognized in sample profiles built from well cuttings. Integration of high-resolution and micro-imaging logs, capillary-pressure data and fluid-inclusion stratigraphy may be the most suitable method in recognizing reservoirs and seal intervals.
The authors gratefully acknowledges the Gas Research Institute for funding this research through Contract No. 5097-260-3777. We are very appreciative to Oryx Energy Company / Kerr McGee Corporation, and in particular Paul Chandler, for the help and support in providing cores, seismic sections, and other information pertinent to this project. We are in debt to James Howard and Phillips Petroleum Company for graciously measuring capillary pressure. Greg Flournoy and John Hubbard from Schlumberger Logging Services for their technical advice and supplying us with FMI digital data. Finally, to Brad Brittian and Melanie McPhail for their help in the preparation of the report.
Al-Shaieb, Z., J. Puckette, A. A. Abdalla, V. Tigert, and P. J. Ortoleva, 1994, The banded character of pressure seals, in Basin compartments and seals: AAPG Memoir, v. 61, p. 351-367.
Al-Shaieb, Z., J. Puckette, P. Blubaugh, P. Deyhim, and H. Li, 1998, Characterization of the low-contrast 9900-ft sandstone, Vicksburg Formation, TCB field, Kleberg County, Texas: Topical Report to Gas Research Institute, Document No. GRI- 98/0240.
Coleman, J. M. C., 1990, Depositional systems and tectonic/eustatic history of the Oligocene Vicksburg episode of the Northern Gulf Coast: The University of Texas at Austin, Ph.D. dissertation.
Combes, J. M., 1993, The Vicksburg Formation of Texas: Depositional systems distribution, sequence stratigraphy, and petroleum geology: AAPG Bull., v. 77, no. 11, p. 1942-1970.
Hall, D., 1999, Applying fluid inclusions to petroleum exploration and production: Fluid Inclusion Technologies, Inc.
Halliburton, 1997, “Electrical micro-imaging service—Discover what you are missing.
International Oil Scouts Association, 1997, International Oil and Gas Development Yearbook, Review of 1995 Production, v. 66, 1071p.
Jennings, J.B., 1987, Capillary pressure techniques: Application to exploration and development: AAPG Bulletin v. 71, p. 1196-1209.
Petroleum Information/Dwights, 1999, Natural Gas Well Production Histories.
Schlumberger, 1992, FMI*—Fullbore formation micro-imager: Pamphlet SMP-5145/M-090253: Schlumberger Wireline & Testing, Houston.
Taylor, D. A., and Z. Al-Shaieb, 1986, Oligocene Vicksburg sandstones of the Tijerina-Canales-Blucher field: a South Texas jambalaya, Gulf Coast Association of Geological Societies Transactions, v. 36, p. 315-339.
Tigert, V., and Z. Al-Shaieb, 1990, Pressure seals: Their diagenetic banding patterns: Earth-Science Reviews, v. 29, p. 227-240.