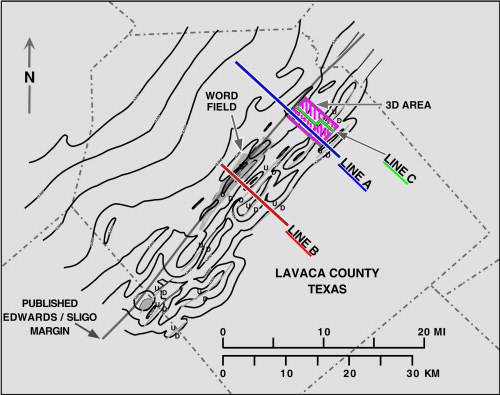
Figure 3--Structure map in the study area drawn on top of the Edwards formation. Contours are every 500 ft (152.5 m), with a regional dip from 11,500 ft (3507 m) in the northwest to 14,500 ft (4422 m) in the southeast. Notice the abrupt change in contour style across the trend of the published Edwards/Sligo margins. The location of Word field, which is a significant Edwards reservoir, is along the Edwards margin trend. The key seismic lines of our study are shown: two-dimensional seismic line A of Figure 4, three-dimensional (3-D) seismic line B of Figure 6 (or Figure 14), and 3-D seismic line C of Figure 9. Line C is out of a 3-D survey that is shown in more detail on Figure 7.