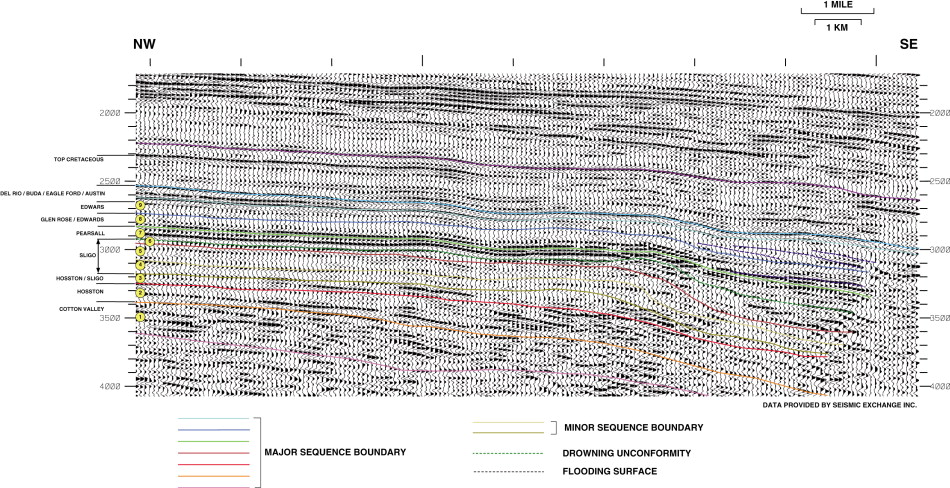
Figure 4--Two-dimensional seismic line A highlights gross stratigraphic surfaces and intervals. The line is located on Figure 3. Nine sequences are identified for the Cotton Valley through Edwards intervals. The colored reflectors indicate the nature of the bounding stratigraphic surfaces. The two plays analyzed during this study are within Edwards sequence 9 and in Sligo sequence 6.