![]() Click to view images in PDF format.
Click to view images in PDF format.
The Attributes of a Wolfcamp “Reef” Play Pecos County, Texas*
By
Philip H. Carlisle1
Search and Discovery Article #10037 (2003)
*Online adaptation of presentation at AAPG Southwest Section Meeting, Fort Worth, TX, March, 2003 (www.southwestsection.org)
1Aspen Integrated Oil & Gas, L.L.C.
The presence of Upper Wolfcamp/Lower Leonard age stratigraphic reefs, or bioherms, as a reservoir target in Pecos County has been proven to be a viable exploration objective.
This objective has been realized by utilizing the integration of geology and 3-D geophysics. A simple geologic model was created to understand the geophysical response of the play. Through this modeling, a focused exploration program for this reservoir target has resulted in twelve new field discoveries, five development wells, and five dry holes for an overall success rate of 77%. This reservoir objective has produced in excess of 480MBO and 6,700 MMCFG since the first discovery well was completed in January 1998.
|
|
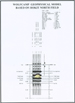
Click here to view sequence of maps of Wolfcamp producers (Figures 12, 14, 15). INTRODUCTIONThe presence of Upper Wolfcamp/Lower Leonard age stratigraphic reefs, or bioherms, as a reservoir target in Pecos County has been proven to be a viable exploration objective. The Wolfcamp reservoir objective has been exploited through the integration of geology and 3-D geophysics. The program was initiated in 1994 after determining that the Wolfcamp would be a viable exploration target with significant potential. A geophysical model was developed based on a simple geologic concept from three key wells in the study area. A key geophysical response, as a result of this model, has been used to develop the play. Without seismic as the key tool to pick drilling locations, the development and addition of reserves would have been extremely difficult, evidenced by the number of historical wells which have penetrated the Wolfcamp, with limited success due usually to a lack in reservoir quality. The result of the project has been a highly successful focused exploration/exploitation program for Wolfcamp, which has resulted in twelve new field discoveries, five development wells, and five dry holes for an overall success rate of 77%. This reservoir objective has produced in excess of 480MBO and 6,700 MMCFG since the first discovery well, based on 3-D seismic, was completed in January 1998. PROJECT LOCATION AND GENERAL GEOLOGY The project area is located in Pecos County, roughly twenty miles east of Ft. Stockton Texas, south of Interstate 10 (Figure 1). The area is characterized by a complex series of deep-seated faults, on the southern side of the Ft. Stockton high, which helped form the Tobosa basin of late Simpson time. On the western edge of the project, more than 17,000feet of relief change can be detected as a result of the faulting at the Ellenburger horizon. The fault trend is locally less than three miles wide, and is situated regionally on the southern edge of the Ft. Stockton high. The influences associated with this faulting were also responsible for creating several large uplifts, one of which includes the Puckett North anticline (Puckett North Ellenburger Field). The Puckett North uplift was important to depositional sequences during Pennsylvanian through early Leonard time, as evidenced by the carbonate buildups found surrounding the uplift. A type log (Figure 2), a structure map based on the Ellenburger (Figure 3A), a schematic diagram depicting a northeast to southeast line of section, A-A’ (Figure 3B), and a schematic sedimentologic cross-section of primary environments (Figure 4) are presented for the project area. The primary focus for this project has been for the Wolfcamp age sediments. Deposition of the Wolfcamp is interpreted to have occurred as a shelf-margin reef and grainstone complex, at the shelf break. The shelf break was set up by the deep-seated faults, seen mostly as pre-Pennsylvanian faulting, but in some instances, reactivated up through the Pennsylvanian and even into early Permian time. The Puckett North anticline was probably an island during early Permian time, and reefs and skeletal sand banks were deposited around the island. Paleo-environmental work was completed for the Wolfcamp on several wells drilled in the area, which helped confirm this concept. Figure 4 depicts the generalized concepts for the area, based on sample analysis and geologic control. Figure 5 is a schematic showing the various environments in this localized area. Focus of the play has been on the reef and grainstone environments of deposition in relatively shallow, high-energy waters surrounding the island complex. Wolfcamp was a known producer in this area, as the Hokit North, Hokit Northwest, and Nuz fields had produced significant quantities of oil and gas from Wolfcamp age reservoirs. Through December 1996, these reservoirs had produced a total of 16.7 BCFG and 384 MBO. Of particular interest was the Hokit North field, which had cumulative production of 8,032,750 MCF and 159,830 BO, primarily from one well, the Sun Oil Co. No. 2-Jasper County School Land “A” well (7,393,422 MCF & 150,292 BO). When closely examined, this well had nearly three-hundred feet of hydrocarbon column, and nearly four-hundred feet of gross Wolfcamp interval, while a direct offset less than nine-hundred feet away had no reservoir present and just over two-hundred feet of gross Wolfcamp interval. Cross-section A-A’ (Figure 6) illustrates the relationship of the field wells. Realizing the potential of the Wolfcamp, the next step was to determine whether the Wolfcamp was a feasible seismic target. A number of sonic logs were available from wells in the area. The Sun Oil Co. No. 2-Jasper County School Land (“JCSL”), the direct offset to the significant producer, had a sonic log, so this was utilized to make the first synthetic seismogram. Figure 7 shows the relationship of the wavelet versus the gamma ray, sonic transit time and sonic porosity through the zone of interest. What became apparent was the Wolfcamp drape shale created a significant response; it is overlain by Leonard age carbonates and underlain by the Wolfcamp “reef” carbonate. The next step was to create a pseudo seismic line based on the geologic model, cross section A-A’. Only the Sun Oil Co. No. 2-JCSL had a sonic log, so for the other two wells on the cross-section a “pseudo-sonic” was created utilizing the sonic from the No. 2-JCSL, altering relative zone thickness and characteristics to match each well. The resulting geophysical model, presented as Figure 8, indicated that a clear anomalous response should be present on seismic acquired over this, or any similar feature. Additional cross section work was then completed to determine the validity of the model, and especially, the continuity of the draping shale, which appeared to be critical to imaging the “reef” interval. Regional cross-section work confirmed that although the depositional environments in the Wolfcamp section change, the draping shale was present over a fairly large area. Several regional cross-sections help to confirm the depositional environments and show the changes in the Wolfcamp section. Figure 9, cross-section A-West to A’-East and Figure 10, cross-section A-North to A’-South both demonstrate the complexity of the Wolfcamp section. The Nuz field, which has also produced significant hydrocarbons, shows that a geologic environment was similar to that found at the Hokit North field area. Although the thickness of the carbonate in producing wells was not considerably different from non-producing wells, the producing wells certainly had developed high porosity grainstone and reefal zones, which are excellent reservoirs. Figure 11 is a cross-section through several wells in the Nuz field area. It was also important to note that the Wolfcamp drape shale was also present across the Nuz field. Having completed field studies, regional cross section work and modeling, a knowledge base had been developed, and was the basis for all future Wolfcamp exploration. As was noted previously, significant production had been established by previous operators in a focused area north of the Puckett North anticline. A relative production bubble map is utilized in Figure 12 to illustrate pre-1996 activity for the area, having cumulative production from the Wolfcamp of 384 MBO and 16.7 BCFG, from a total of fifteen wells. Discovery of these Wolfcamp reserves was primarily from drilling for deeper objectives. 3-D seismic was first acquired in the study area in early 1996, which included data across the No. 2-JCSL “A” well. Although some difficulties occurred as a result of the severe topography and surface geology variations, data verified that it was possible to image the Wolfcamp “reef” interval. Gross carbonate thickness changes occurring as a result of reefing were visible on the data acquired. Figure 13 is a seismic line through the Hokit, North Field area. It is apparent from the seismic data that the No. 2-JCSL “A” well penetrated an anomalously thick interval, noted by an amplitude change seen in the trough as a result of reservoir thickening between the Wolfcamp drape shale and the base of the Wolfcamp “Reef” carbonate. Based on the early modeling work and subsequent characteristics seen on the seismic shot across the No. 2-JCSL “A” well, several 3-D programs have been acquired, for a total of approximately ninety square miles. A total of twenty-one wells have been drilled on the various 3-D shoots, specifically for the Wolfcamp. Of these wells, sixteen have been completed as producers. Figure 14 shows the wells that have been drilled as a result of character responses on the geophysical data. Since the first discovery well in January 1998, a total of 480 MBO and 6.7 BCFG have been produced. Play development from the beginning is illustrated by Figure 15, which shows all wells that have been completed in the Wolfcamp, for a total of 864 MBO and 23.4 BCFG produced to date. The Wolfcamp is an intriguing reservoir target. Of the sixteen successful wells drilled in the program, few wells have similar reservoir performance. In general, it can be said that reservoir has high permeability. Tests indicate two darcies of permeability are not uncommon. Vertical barriers are not often found, as perforations low in the section will often drain the reservoir pressure throughout the entire Wolfcamp “reef” section. Most of the reservoirs are pressure depletion drives, although water movement and pressure support is present in the Habanero Field. This field has produced the greatest quantity of oil from any single reservoir development, having a cumulative in excess of 245 MBO, primarily from one well. Bottom hole pressure surveys have shown minimal reservoir pressure decline. Lateral heterogeneity is somewhat unpredictable, as would be expected in a carbonate environment. The 1-Ancho, an early well in the program, offset several Wolfcamp producers drilled in the mid 1960’s that had produced over 2.5 BCFG from the Wolfcamp (Hokit, Northwest Field). Although the 1-Ancho was located in a position structurally favorable, and had tremendous reservoir quality, the reservoir pressure had been depleted by the offset wells. These offset wells did not have the same quality of reservoir, although thin zones of good quality reservoir were present. Reservoir pressure was calculated to be 789 psi from a drillstem test taken in the upper Wolfcamp “reef” interval. Figure 16 is a cross-section showing several wells in the Hokit Northwest field relative to the 1-Ancho. In the same area, but on a larger scale, lateral heterogeneity is quite prevalent. As more wells in this particular area are included in a review, it becomes clear that multiple reservoirs are present, confirmed by different reservoir pressures. Cross-section HokitNW-HokitNW’ (Figure 17) illustrates a larger area that shows the heterogeneity of the reservoir. These wells are near the Ancho feature, but show quite different reservoir characteristics. Of particular interest is the 1-Arbol, which was completed in September of 2000, and has cumulative production of over 93 MBO and 302 MMCFG. An original reservoir pressure of 2,833 psi was encountered on drillstem test in the Wolfcamp at this location. Several Nuz field producers accentuate another example of the heterogeneity found in the Wolfcamp reservoirs. Cross-section Nuz-Nuz’ (Figure 18) demonstrates that several carbonate reservoirs are present over a short distance. Reservoir pressures are noted on the cross-section, with a low of 152 psi (abandoned in 1999) to a current original bottom hole pressure of 2637 psi in a well completed in 2000 as part of the 3-D drilling program. These bottom hole pressures clearly support that these wells are producing from separate carbonate reservoirs. One of the major obstacles of the play has been in acquiring and processing reliable seismic data. This is largely due to two factors. The first is the severe topographic changes that occur as a result of mesas being present in the project area. The second is the surface geology. Cretaceous age limestones are present, including the Edwards, which makes data acquisition difficult due to the fact that the source tends to ring, and high frequencies are lost. Data acquired at the objective depth is typically between 15 and 25 Hz. Resolution is therefore reduced considerably due to the low frequencies recovered. Processing data is difficult as well, and stacking velocity changes occur locally, often creating anomalous artifacts in the seismic data. Typically, fairly significant changes are found each time the data is processed. This makes interpretation difficult, as results on the processed data differ even across defined field areas. It has usually been the interpreter’s choice to closely examine multiple data sets and then to choose the most appropriate one based on geologic control and expectations of the reservoir in the area. Drilling and operations have been difficult for the area as well. This is a fairly remote area, and there is limited access to many of the well locations. Figure 19 is a topographic map depicting some of the locations drilled as a result of the project. Elevation changes exceeding thirteen hundred feet are not uncommon from the top of the mesa to the base. As few roads are present, it often takes a forty plus mile drive to go from the base of the mesa to the top. Operations are complicated by the fact that each reservoir behaves differently. Variations in GOR, produced water, original and depleting reservoir pressures, H2S content, and other variables, makes this a challenging project operationally. Significant hydrocarbons have been produced from the Wolfcamp interval, which has proven to be an excellent carbonate reservoir target in Pecos County. Early development of Wolfcamp reserves was primarily found drilling deeper objectives. Without the application of geophysics, and specifically 3-D, the development of the recent reserves would have been difficult. The overall success rate has been high, even though the geophysical data quality has been negatively affected by acquisition and processing factors. Geophysical problems have been minimized through careful data analysis. As evidenced by the 77% success rate, the integration of geophysics into this exploration/development program has been beneficial in picking the right place to drill. REFERENCESWright, W. Floyd, 1979, Petroleum Geology of the Permian Basin, West Texas Geological Society, Publication No. 79-71. Scholle, Peter A., Bebout, Don G., and Moore, Clyde H., 1983, Carbonate Deposition Environments, AAPG Memoir 33. Peppard & Associates, 1982, The Wolfcamp and Pennsylvanian Sediments of the Ozona Platform, Project 20230. ACKNOWLEDGMENTSThe author wishes to thank R.E. Glasscock and John W. Ruwwe, Jr. for their believing in the author and the project. These individuals have been supportive in many ways throughout the development of this project, making this not only a successful endeavor, but also a personally rewarding venture. |


