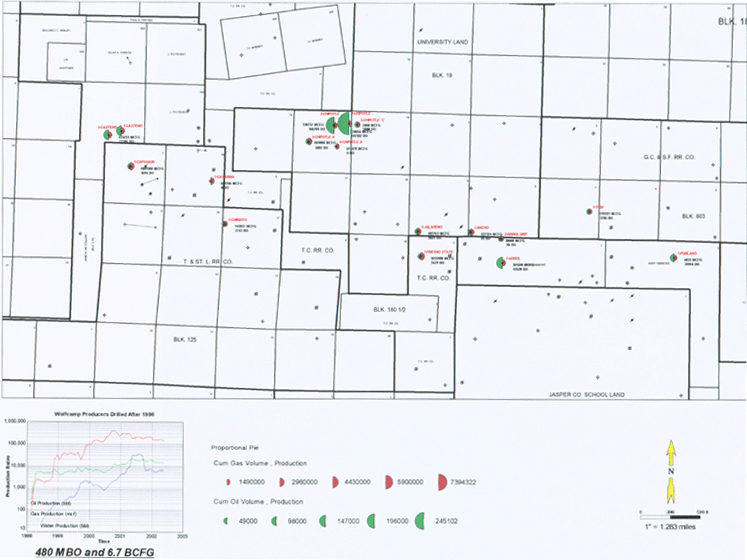
Figure 14. Project area basemap showing Wolfcamp producers completed after 1996, as part of the program. Oil and gas cumulatives are relative by bubble size. Production decline curve and cumulative is for these wells only.
Figure 14. Project area basemap showing Wolfcamp producers completed after 1996, as part of the program. Oil and gas cumulatives are relative by bubble size. Production decline curve and cumulative is for these wells only.