AAPG ANNUAL CONFERENCE AND EXHIBITION
Making the Next Giant Leap in Geosciences
April 10-13, 2011, Houston, Texas, USA
Stratigraphic Trapping in the M1 Sandstone Related to Reactivated Faulting in the Mariann Field, Oriente Basin, Ecuador
(1) Exploration Department, Andes Petroleum Ecuador Ltd., Quito, Ecuador.
(2) CNPC International Research Center, China National Petroleum Company, Beijing, China.
Introduction
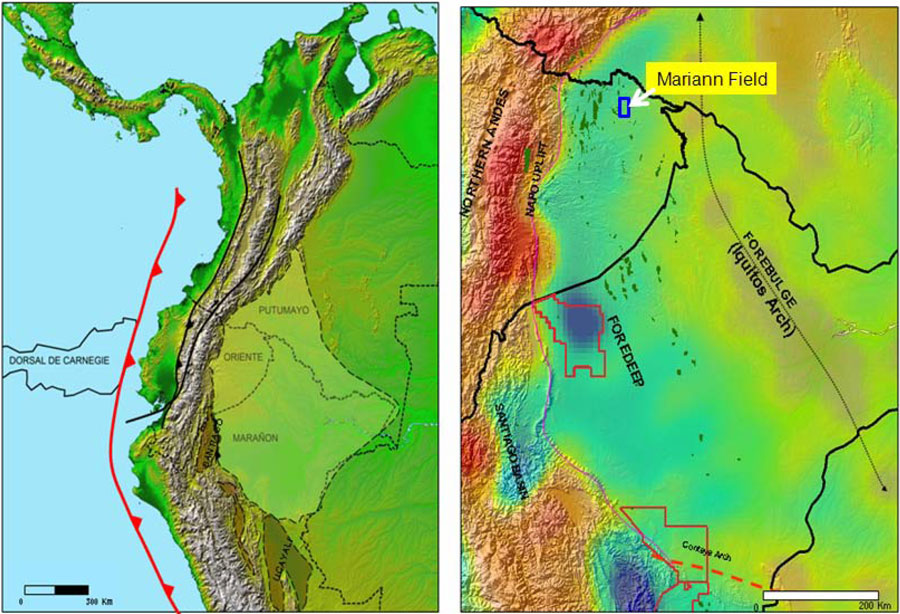
The Putumayo-Oriente-Maranon Basins of Colombia, Ecuador and Peru respectively (Figure 1) one of the most prolific petroleum systems of NorthWestern South America, are part of the asymmetric foredeep portion of the present day sub-Andean retro-arc foreland system linked to the Andean orogen. Currently more than 10 BBO of recoverable reserves have been discovered (~45 BBO estimated oil in place) in an area of approximately 300,000 square Km. This “supercharge” basins are mainly associated with the same petroleum system “the Napo-Chonta” (Barragan et al. 2009).
Pre Cretaceous in Oriente Basin
During the late Triassic to early Jurassic an extensional regime affected these basins, syn-rift deposits filled the half grabens (Sacha, Santiago, and Pucara Formations), (M. Diaz, 2000).
At Middle Jurassic age a SE-NW volcanic arch emerges from Peru up to Colombia, they are known in Ecuador as Misahualli Volcanics, Chapiza formation and further to the east the Tambococha Formation, this event ends the opening of the rift. Finally at late Jurassic-early Cretaceous the subduction occurs to the NorthEast. A relatively normal sedimentation rate succeeded, only the subsidence in the half grabens dealt with the major thickness changes.
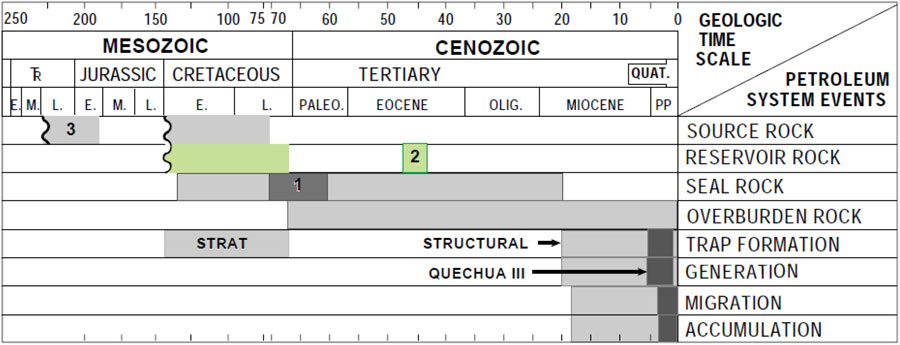
A great help for understand the rest of the geological events are shown in the Figure 3.
Cretaceous
At Aptian age, a westward & southward thicken layer covered a flat surface, a regional NE dip controlled its distribution, this is known as Caballos, Hollin and Cushabatay formations in Colombia, Ecuador and Peru respectively, another 4 more prograding - retrograding sequences occurred up to Maastrichtian age, they are Napo T, Napo U, Napo M2, Napo M1.
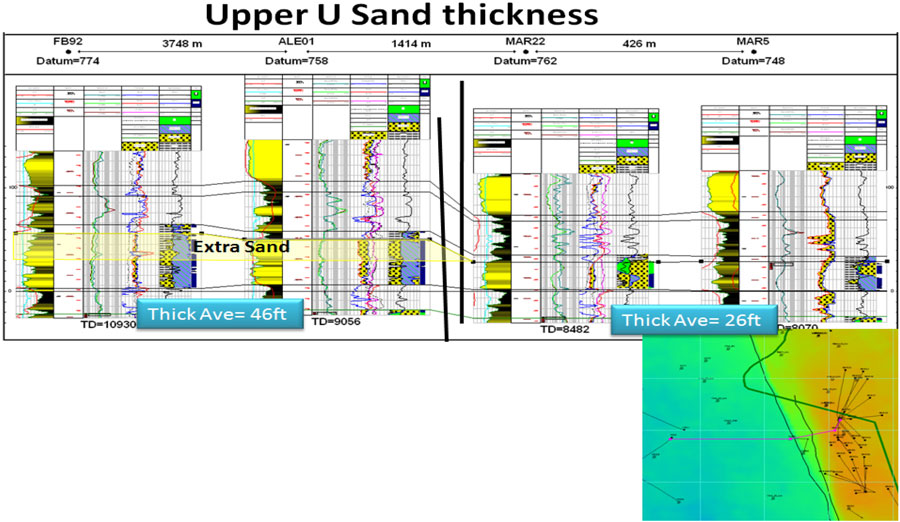
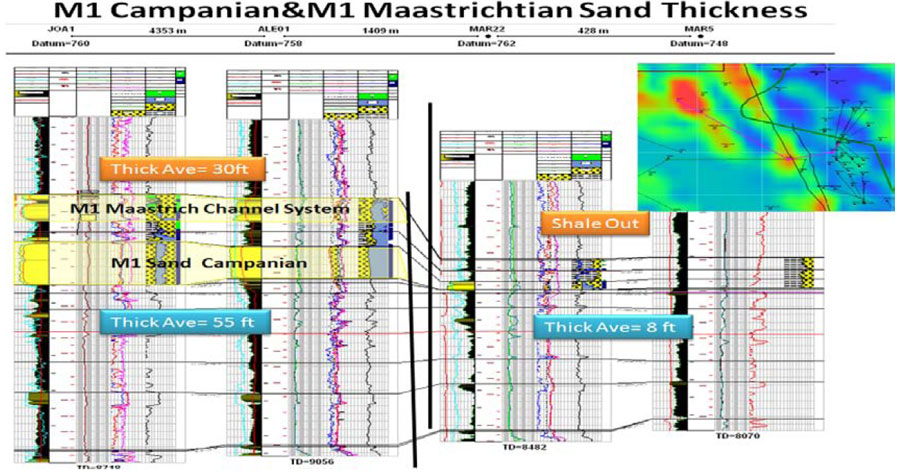
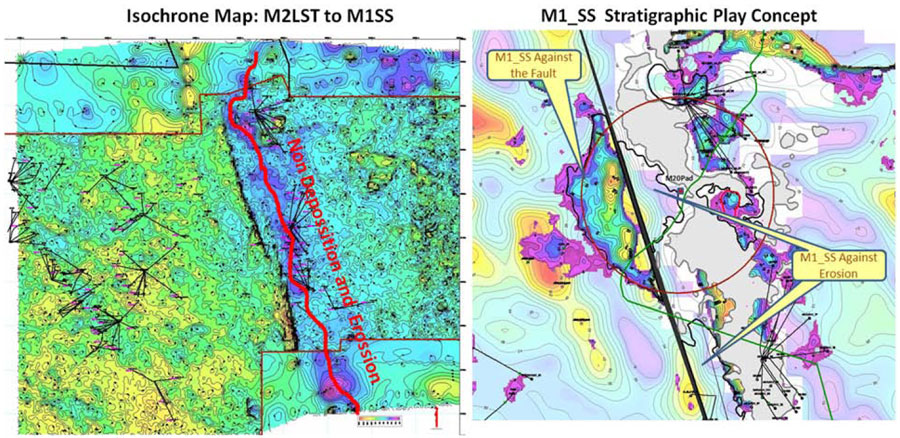
During Coniacian the inversion of pre-cretaceous Normal faulting started on Mariann Area, see Figure 4 of Upper U Sandstone across two blocks of Mariann Fault. But the major Cretaceous transpressive movement occurred during the end of Campanian and all Maastrichtian, causing non deposition on the highs and erosion from uplifted blocks, see Figure 5.
Stratigraphic Pool
Even the stratigraphic play concept has been developed, an structure component also is quite important, for instance on the Fanny-Dorine stratigrapich field every geologist is drilling wells on small highs basically due to difference of densities of Water, Oil, and Gas.
M1 Campanian (Main M1_SS)
Generation of isochrone maps between M2_limestone horizon and M1_SS horizon provided the first idea about the highs and lows, see Figure 6.
M1 Maastrichtian (Upper M1)
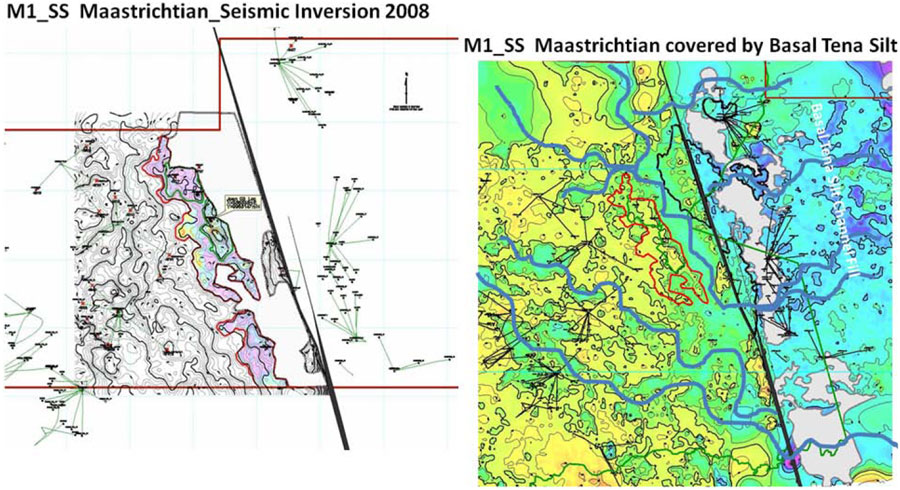
Show maps and careful well and seismic correlation were performed in order generate a possible M1 Maastrichtian (called Upper M1). At April of 2008 a seismic inversion were performed in Beijing, showing up a NW_SE trend, see Figure 7. During 2010 deeper reservoirs were also mapped then the area becomes more attractive. For this reservoir the main risks are: oil charge but it is mitigated in part by the multizone potential.
Conclusions:
Due to inversion faulting, on this area is very complicated to map the sand distribution. The movement of fault started at ~90 Ma, as shows Upper U sandstone isochrone and Isopach mapping.
During the Campanian age the Mariann Field were uplifted, no sand were deposited, but at the end of Maastrichtian the movement rate increased, causing erosion on Mariann field and re-deposition on the foot wall side of the fault. The regional uplift was temporarily exposed then rapid and linear erosion happened. After the younger Basal Tena silt-sand filled everything.
There are three sands: M1 Campanian (Main M1), M1 Maastrichtian (Upper M1) and Basal Tena Sand (End of Maastrichtian-Early Paleocene).
The main risks for Main M1in the footwall block is the sealing of the fault, the risk for upper M1 basically is the Oil charge, but those are mitigated in part by the multizone potential.
At the end of August of 2011 Andes will drill two exploratory wells on this area.
Bibliography
Barragan R. et al, 2009. The Origen of Maranon-Oriente Basin Cretaceous Oils: The Santiago-Situche kitchens, a new alternative model.
USGS, 2001. The Putumayo-Oriente-Maranon Province of Colombia-Ecuador, and Peru---Mesozoic-Cenozoic and Paleozoic Petroleum Systems. V1.
Silvestro J. et al, 2002. Reactivacion Tectonica en el Borde Este de la Cuenca Oriente, Ecuador.
Diaz M. 2000. Caracterizacion y Reconstrucción Paleogeografica de las cuencas Pre-Aptenses en el Oriente Ecuatoriano.
Taday A. 2001. Interpretacion Estructural-Estratigrafica de la Arenisca U en el Proyecto Sismico Mariann 3D.