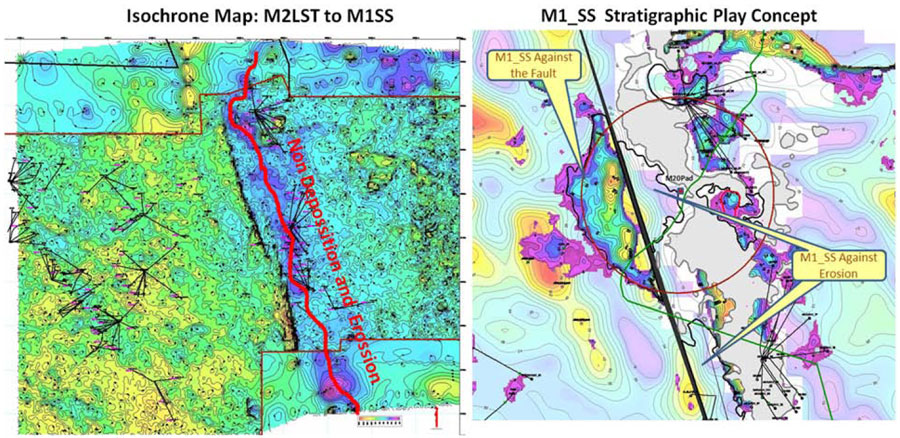
Figure 6. Prospect Generation for M1 Sandstone Campanian, left: Isochrone map showing the thinning in the blues and thickening in yellows. Right: Prospective area against the erosional crest and against the Fault.
Figure 6. Prospect Generation for M1 Sandstone Campanian, left: Isochrone map showing the thinning in the blues and thickening in yellows. Right: Prospective area against the erosional crest and against the Fault.