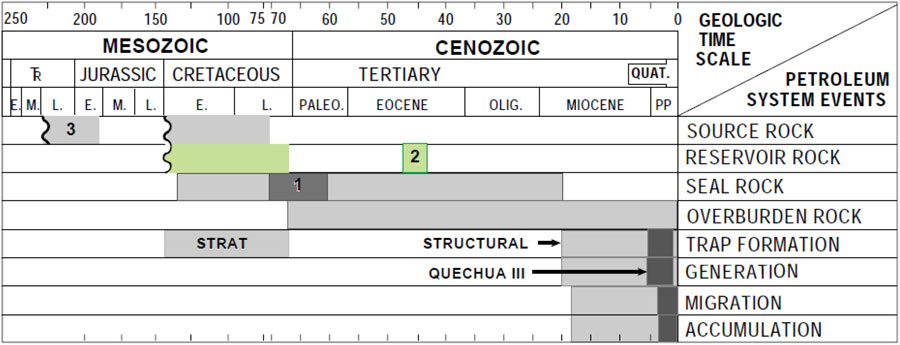
Figure 3. A Basin Analysis Chart explain the Source, the reservoir, the seal and the Overburden Rocks, also the timing of Structural-Stratigraphic Trapping, Generation, Migration and Accumulation for Hydrocarbons.(after USGS)
Figure 3. A Basin Analysis Chart explain the Source, the reservoir, the seal and the Overburden Rocks, also the timing of Structural-Stratigraphic Trapping, Generation, Migration and Accumulation for Hydrocarbons.(after USGS)