--> Characterization of the Woodford Shale in Outcrop and Subsurface in Pontotoc and Coal Counties, Oklahoma, by Ryan Miller and Roger Young, #50052 (2007).

Datapages, Inc.Print this page

Click to view posters in PDF format.

Poster 1 (~1.5 mb)          Poster 2 (~1.7 mb)          Poster 3 (~1.3 mb)


PSCharacterization of the Woodford Shale in Outcrop and Subsurface in Pontotoc and Coal Counties, Oklahoma*

By

Ryan Miller1 and Roger Young2


Search and Discovery Article #50052 (2007)

Posted September 5, 2007


*Adapted from poster presentation at AAPG Annual Convention, Long Beach, California, April 1-4, 2007.


1Devon Energy Corporation, Oklahoma City, OK ( [email protected] )

2University of Oklahoma, Norman, OK


Abstract 

In the Arkoma basin the Woodford shale has been exploited as an unconventional resource due to advancements in the geological and engineering fields in the past three years. Gas production from the Woodford shale is facilitated by natural and hydraulic fracturing of the formation. The focus of this study is the characterization of the Woodford to better understand the natural fracturing. Data in the form 2D and 3D seismic data sets, well logs and a Woodford shale outcrop were utilized.  

The Woodford shale was interpreted on available well data. The resulting tops were correlated to the 2D and 3D seismic data sets to provide a regional stratigraphic and structural interpretation of the Woodford in the study area.  

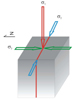
The principal stress components were characterized from the world stress map and FMI data. Well logs in the 3D seismic survey served as the primary source of local paleostress and in situ stress orientations. The orientation of the faults and joints in the study area were correlated based on strike and dip. The result is a change in the strike orientation and degree of dip over the twenty-six miles separating the outcrop and the 3D seismic survey. The resulting characterization of the Woodford shale will facilitate gas production by exploiting natural fractures.

uAbstract

uHypothesis

uObjectives

uWell control

uSeismic

uFaults & fractures

uConclusions

uReferences

uAcknowledgements


uAbstract

uHypothesis

uObjectives

uWell control

uSeismic

uFaults & fractures

uConclusions

uReferences

uAcknowledgements


uAbstract

uHypothesis

uObjectives

uWell control

uSeismic

uFaults & fractures

uConclusions

uReferences

uAcknowledgements


uAbstract

uHypothesis

uObjectives

uWell control

uSeismic

uFaults & fractures

uConclusions

uReferences

uAcknowledgements


uAbstract

uHypothesis

uObjectives

uWell control

uSeismic

uFaults & fractures

uConclusions

uReferences

uAcknowledgements


uAbstract

uHypothesis

uObjectives

uWell control

uSeismic

uFaults & fractures

uConclusions

uReferences

uAcknowledgements


Hypothesis 

Stress fields in the Woodford Shale can be correlated in outcrop and subsurface. The relationship between fractures in outcrop and faults in the subsurface and their related stresses can provide guidance in lateral orientation and efficient recovery efforts.


Objectives 

The primary objective of this project was to develop an understanding of the relationship between fracturing, faulting, and associated stresses within the Woodford Shale in the subsurface and in outcrop. A 3D seismic volume, 2D seismic lines, and an outcrop was correlated by mapping the Wapanucka and Woodford seismic horizons. The seismic data was validated with extensive well control and a synthetic tie. The data was then tied to the outcrop along an arbitrary cross-section line.

Figure 1-1. A topographic map of central United States. The approximate extent of the Arkoma Basin is outlined in bold, with the study area indicated by a red box on the western side of the basin (Perry, 1995).

Figure 1-2. Fractures on outcrop in study area.

Figure 1-3. A detailed map view of the area of research. The 2D seismic lines are indicated in gray. The 3D seismic survey is outline in green (in the eastern part). Well A, shown as a green circle, is located within the 2D survey. The outcrop extent of the Woodford Shale is highlighted in purple to the west. A blue line connects the wells to indicate the extent of the cross section.


Well Control 

Figure 2-1. A dip analysis log plot extracted from an FMI log ran in Well A highlights the three fracture types typically encountered in the Woodford. The closed and drilling-induced fractures have a general S90E orientation. The plot also shows the Woodford has a shallow dip. 

Figure 2-2. A cross section from the study area. The extent of the three data sets is indicated relative to the cross section. The red and purple lines delineate the Wapanucka and Woodford formations respectively. The faults are indicated by dark green. The cross section exemplifies the general eastward structural dip in the study area. 

Figure 2-3. The Woodford horizon picked on a grid of 2D seismic lines. The horizon has been rudimentarily depth converted. The resulting map shows the relative basinward dip of the Woodford from approximately 900 ft at outcrop to over 7500 ft within 3D survey area.


  • In well A drilling-induced fractures were found to strike approximately S80E.

  • The borehole breakouts are approximately oriented N05E indicating the minimum horizontal stress component.

  • Faults were found to strike N12E-N24E with a dip of approximately 56o.

  • Natural fractures, assumed to parallel in situ stresses, were found to strike S85E.

  • Mineral-filled fractures are limited to the lower Woodford with a S36E orientation.

  • The majority of the induced and natural fractures strike S86E.

  • Approximately 10 cemented fault planes between the Wapanucka limestone and Caney Shale indicate a general S89E strike.


Seismic 

Figure 2-4. The dip of the Woodford, purple, is less homogeneous in cross section. Large offset normal faults, dark green,divide the Woodford's dip into the basin. The regional faults in this study area can have 1200 ft+ throws. The faults are regional in nature enabling a general structural view from only 2D seismic lines.


Faults and Fractures 

Figure 2-5. An eastward-facing photograph from the Woodford outcrop. The green arrows point toward the primary east-west fractures. The fractures are evenly separated by approximately 7 meters and extend beyond the project area. 

Figure 2-6. A close-up of the box from Figure 2-5. The primary east-west striking fracture set can be seen in the vertical face of the weathered Woodford Shale. The vertical faces correspond to the fractures seen on the quarry floor. 

Figure 2-7. Map view photograph of a section of the quarry floor. The black arrow is pointing to a fracture from the primary set. The white arrow is pointing to a fracture from the secondary set which terminates in the vicinity of the primary fracture. 

Figure 2-8. The strike of all joints and faults in a section was plotted to determine a strike trend in the study area. The number of samples, joints and faults, are represented by symbol size. The strike trend of both was found to rotate to the North from S90E in the West to approximately N45E in the East.


  • Fractures typically appear as complementary sets consisting of multiple types and orientations. While the absolute age of the fracture sets is difficult to determine one may estimate age of the sets relative to one another (Kulander et al., 1979; Pollard and Aydin, 1988; Twiss and Moores, 1992).At the Woodford outcrop there is a one fracture set striking N90E, termed the primary set, and one striking approximately S60E, termed the secondary set.

  • The primary fracture set is considered the older set because it consists of parallel, systematic fractures (Pollard and Aydin, 1988).

  • The majority of the nonsystematic fractures terminate at the intersection of the primary set at the outcrop. The pre-existing primary fracture appears to be a mechanical boundary to the later sets (Gross, 1993).


Figure 3-1. This simplified model of a typical Woodford fracture was developed from well data and outcrop observations. The red line represents a S90E-striking fracture with a near vertical dip component. The maximum horizontal stress, s2, was determined from the orientation of drilling-induced fractures. The minimum stress component, s3, is based on borehole breakout data.  

Figure 3-2. Data from the study area was used to create this model. The model is based on Andersonian stress regime and highlights the three principal stresses. The strike of the fault is approximately N45E. As expected in an extensional environment the magnitude of the principal stresses is defined by the relationship s1 > s2 > s3. Adapted from Lacazette (2000).


Conclusions 

  • The general strike of the faults in the study area is equivalent to s2 in nearby wellbores based on FMI logs and borehole breakout data. Therefore in this area in situ stresses are approximately equivalent to paleostresses.

  • This observation suggests tectonic activity, including faulting and flexure, after the formation of Woodford fractures.

  • This observation suggests post-fracture tectonic activity, including faulting and flexure, would not cause a reorientation of the fractures.

  • Red staining around the outcrop from pyrite leaching demonstrates the permeable nature of the open fractures.


References 

Gross, M.R., 1993, The origin and spacing of cross joints: examples from the Monterey Formation, Santa Barbara Coastline, California: Journal of Structural Geology, v. 15, p. 737-751.

Kulander, B.R., C.C. Barton, and S.L. Dean, 1979, The application of fractography to core and outcrop fracture investigations: Morgantown Energy Technology Center, United States Department of Energy, METC/SP-79/3.

Lacazette, A., 2000, Natural fracture nomenclature, in L.B. Thompson, ed., Atlas of Borehole Images: AAPG/Datapages Discovery Series 4, Disc 1 (of 2), 13 p.

Pollard, D.D., and A. Aydin, 1988, Progress in understanding jointing over the past century: Geological Society of America Bulletin, v. 100, p. 1181-1204.

Twiss, R.J., and E.M. Moores, 1992, Structural Geology: Freeman, New York, 532 p.


Acknowledgements 

Dr. Roger Slatt of the School of Geology and Geophysics, University of Oklahoma; Dr. Bill Coffey and Rod Gertson of Devon Energy.


Return to top.