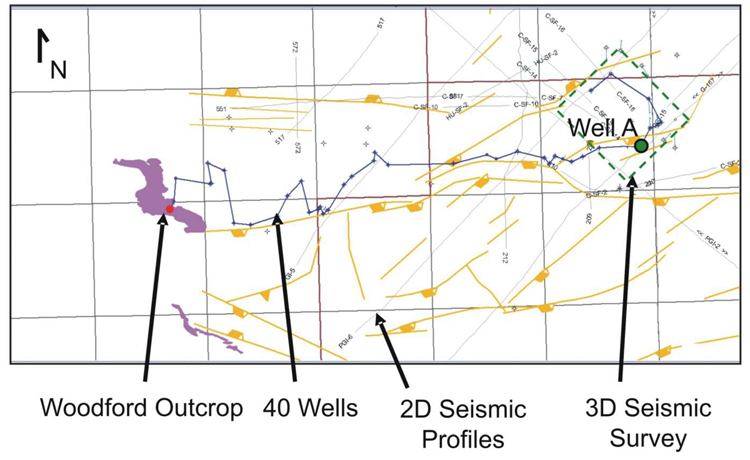
Figure 1-3. A detailed map view of the area of research. The 2D seismic lines are indicated in gray. The 3D seismic survey is outline in green (in the eastern part). Well A, shown as a green circle, is located within the 2D survey. The outcrop extent of the Woodford Shale is highlighted in purple to the west. A blue line connects the wells to indicate the extent of the cross section.