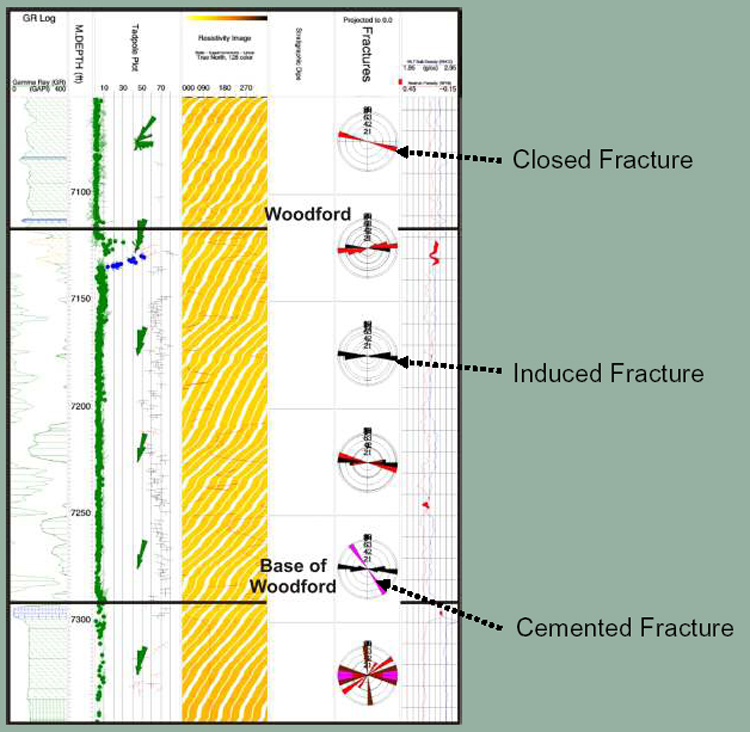
Figure 2-1. A dip analysis log plot extracted from an FMI log ran in Well A highlights the three fracture types typically encountered in the Woodford. The closed and drilling-induced fractures have a general S90E orientation. The plot also shows the Woodford has a shallow dip.