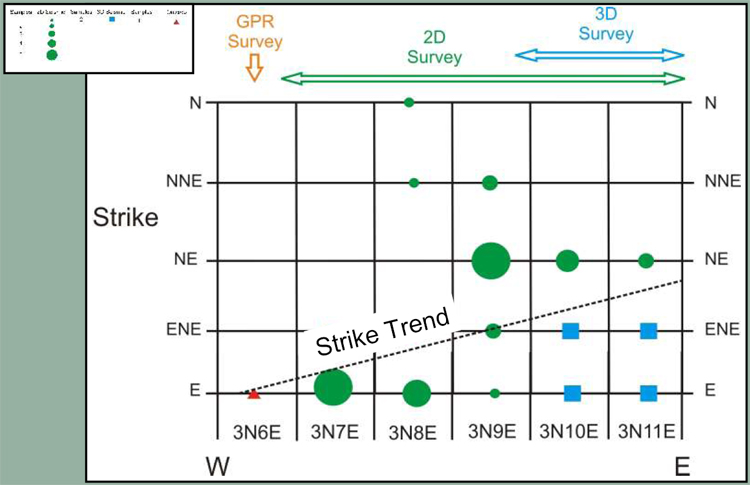
Figure 2-8. The strike of all joints and faults in a section was plotted to determine a strike trend in the study area. The number of samples, joints and faults, are represented by symbol size. The strike trend of both was found to rotate to the North from S90E in the West to approximately N45E in the East.