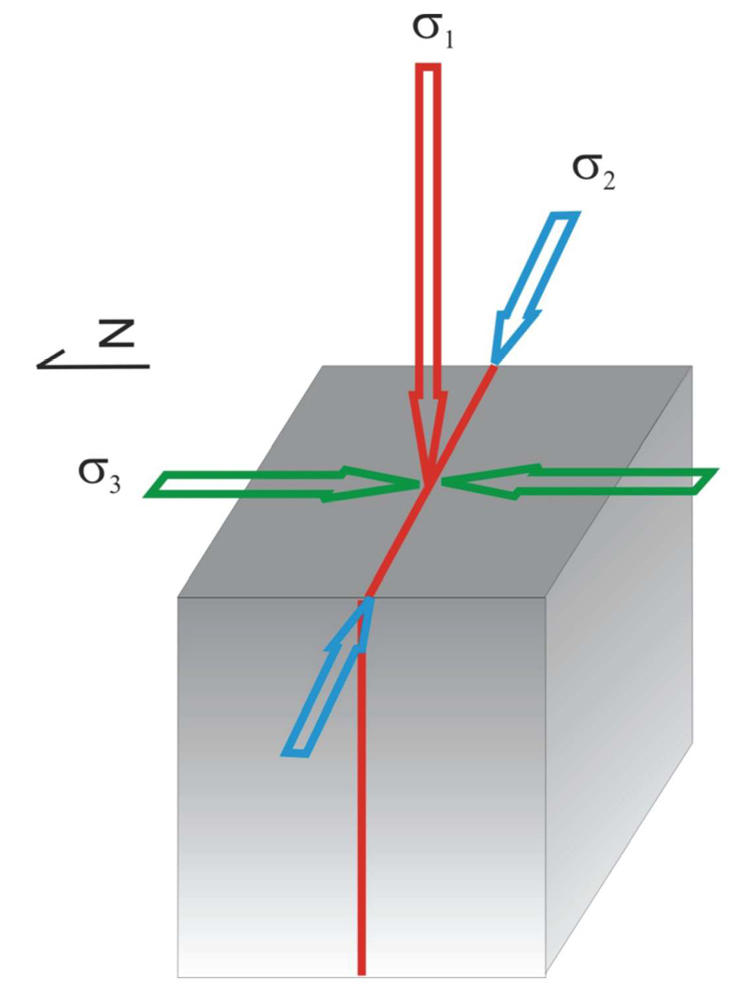
Figure 3-1. This simplified model of a typical Woodford fracture was developed from well data and outcrop observations. The red line represents a S90E-striking fracture with a near vertical dip component. The maximum horizontal stress, s2, was determined from the orientation of drilling-induced fractures. The minimum stress component, s3, is based on borehole breakout data.