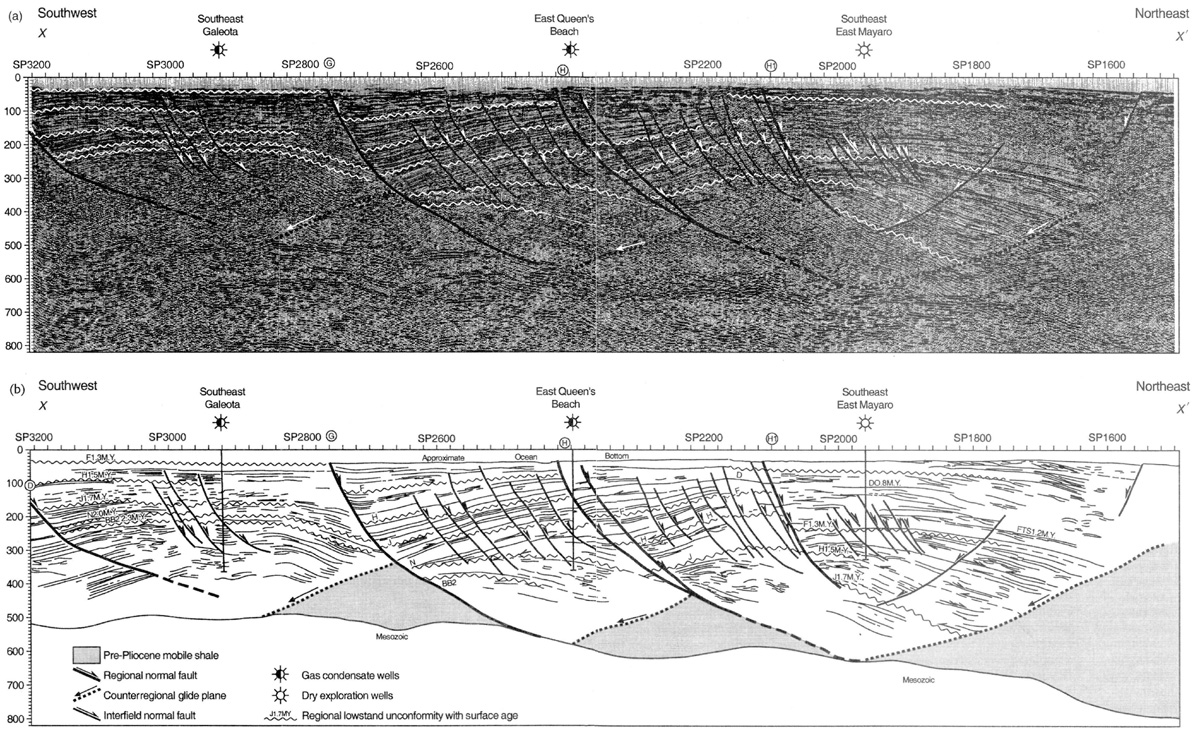
Figure 5. (a) Southwest-northeast–trending seismic line XX' (see Figure 4 for location) and (b) accompanying line drawing illustrating the two-dimensional geometry of normal fault and counterregional glide surface and their relationship to one another. Regionally extensive lowstand surfaces (unconformities) and their basinward-equivalent correlative conformities that bound megasequences are shown. Note the thickening of sediments down into the counterregional surface and the upturned toe reflectors associated with sediment drag as shale evacuates from beneath the sediment wedge (SP1800–1600 between 3.0 and 5.0 s). Sediment wedges thin landward (southwest) and show truncation of their upper parts by means of the lowstand surface of the overlying sequence. Significant thickening of sediments occurs across major normal faults (SP2100, SP2740). Although similar seismic facies are identifiable in different fault blocks at approximately the same seismic depth, they are of different ages, as shown by biostratigraphic data (see Figure 10).