![]() Click to view page images in PDF format.
Click to view page images in PDF format.
3-D Seismic in the Glennpool Area, Northeastern Oklahoma*
By
Christopher L. Liner1
Search and Discovery Article # 40040 (2002)
*Adapted for online presentation from a presentation to the Tulsa Geological Society, January 8, 2002
1Department of Geosciences, University of Tulsa, Tulsa, OK ([email protected]). Acknowledgment is made to D. Kerr and M. Kelkar, DOE project managers for geology engineering, respectively, for well data, especially those from Self #82, and to Producers Oil, Opseis, and Mercury International Technology in relation to the 3-D seismic data.
In 1996 a small 3-D seismic survey was acquired on the
west edge of the Glenn Pool oil field, near Tulsa, Oklahoma, to map a producing
120-acre Ordovician Wilcox structure. The goal was to establish a template for
the detection of such structures elsewhere. Among other results, the project
revealed the added value of 3-D imaging even in areas of dense well control and
the misalignment of ![]() time
time![]() and depth structures.
and depth structures.
|
uMaps, seismic tracking, & depth conversion
uMaps, seismic tracking, & depth conversion
uMaps, seismic tracking, & depth conversion
uMaps, seismic tracking, & depth conversion
uMaps, seismic tracking, & depth conversion
uMaps, seismic tracking, & depth conversion
uMaps, seismic tracking, & depth conversion
|
The objectives of the project are: · Leverage DOE project well information. · Provide an analog for Ordovician Wilcox exploration. · Get a view of the Pennsylvanian Glenn interval adjacent to Glenn Pool oil field. · Test small-scale 3-D seismic survey in Northeastern Oklahoma. There are a total of 17 wells in Sections 19/24, N17N, R12E (Figure 1). Production was discovered in June, 1985, in the Wilcox Sandstone (Ordovician Simpson Group) at a depth of approximately 2500 ft. Thickness is as much as 34 ft, and porosity is up to 18%. Cumulative production through 1996 was 950,000 barrels of oil. The productive feature is a nose, covering approximately 120 acres, on the southwest flank of Glenn Pool oil field. Self unit #82, in Section 21, T17N, R12E, is located approximately 2miles from the area of the 3-D survey. The suite of logs includes DIL, LDL, BHC, CNL, GR, and SP.
– Sonic+Density => velocity X density = Impedance –
Sonic => velocity =>
Using the sonic and density logs from the Self #82, an acoustic impedance log was prepared (Figure 2). The
sonic log can be ignored if the sonic values are predictable from the more
common density log. In the case of the Ordovician Wilcox Sandstone (Figure
3), the relation of sonic to density values suggests that density values
of themselves may be satisfactory. On the other hand, plots of the sonic
vs. density values for the Pennsylvanian Glenn Sandstone (Figure 4) and
for the entire stratigraphic interval (Figure 5) are such that the sonic
values cannot be ignored in calculating acoustic impedance for synthetic
seismograms. Figure 6 shows the velocity (from sonic values) in Self #82,
from 300 ft to total depth, along with formation tops, plotted according
to Features of 3-D seismic data used in this study are: – Vibroseis, with bin size of 55 x 55 ft – 141 E-W lines x 145 N-S lines – 1420 acres, 2.2 square miles – 1 sec, 2 ms – Frequency band--15-120 Hz
Based on the calculation in equation (1), the 55-ft bin size is a little too large because fault imaging is degraded and dips greater than 34o are also degraded.
Bin <Vint / (4 fmax) = 15000 / (4 X 120) = 31 ft (1)
The vertical resolution is shown by equation (2) to be 62 ft. Correspondingly, the Wilcox, with thickness of 34 ft or less, is a “thin bed.” Lateral resolution, given in equation (3), is 155 ft, or approximately 2 bins. Structural resolution is 11 ft, as derived in equation (4) and illustrated in Figure 7.
VR = Vint / (4fdom) = 15000 / (4 X 60) = 62 ft (2) LR = 2 X VR = 144 ft (~ 2 bins) (3) DZ = (VavgdT)/2 = 1000 X .002 / 2 = 11 ft (4)
Data footprint is shown by the images of the survey area in Figure 8, with outline of live traces (Figure 8A) and outline of the area with well spots (Figure 8B). Data
cube is illustrated in Figure 9, with a Improved
quality of the data is illustrated in Figure 10, with the original
Maps, Seismic Tracking, and Depth Conversion With
the data described above, a well-depth structure map was made of
Ordovician Wilcox sandstone (Figures 12,
13, 14, and
16) and comparable
The following are conclusions from this 3-D study, some 1420 acres in size, of an oil-productive area, near Tulsa in northeastern Oklahoma: ·
Data improvement through smoothing by ·
· Postage-stamp sized 3-D seismic surveys can add detail (and detail adds value).
Liner, C.L., 1999, Elements of 3-D seismology: Tulsa, PennWell, 438 p. |
 Figure
1.
Figure
1. Figure
3. Density vs. sonic values for Ordovician Wilcox Sandstone in Self #82,
showing a fair level of correlation (R2 = 0.6319).
Figure
3. Density vs. sonic values for Ordovician Wilcox Sandstone in Self #82,
showing a fair level of correlation (R2 = 0.6319). Figure
4. Plot of density vs. sonic values for Pennsylvanian Glenn Sandstone in
Self #82 does not show a significant correlation between them.
Figure
4. Plot of density vs. sonic values for Pennsylvanian Glenn Sandstone in
Self #82 does not show a significant correlation between them. Figure 5. Plot of density vs. sonic values for the entire stratigraphic
interval in Self #82 does not show a significant correlation between them.
Figure 5. Plot of density vs. sonic values for the entire stratigraphic
interval in Self #82 does not show a significant correlation between them. Figure
6. Velocity (sonic) log of Self #82 plotted according to
Figure
6. Velocity (sonic) log of Self #82 plotted according to  Figure
7. Structural resolution, as illustrated by minimum step down (dt), is
determined to be 11 ft, with the assumption of perfect removal of shallow
effects.
Figure
7. Structural resolution, as illustrated by minimum step down (dt), is
determined to be 11 ft, with the assumption of perfect removal of shallow
effects.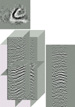 Figure
9. Components of data cube (
Figure
9. Components of data cube ( Figure
12. Structure map, along with index maps, on top Ordovician Wilcox
Sandstone. Well depths are feet below 700 ft datum.
Figure
12. Structure map, along with index maps, on top Ordovician Wilcox
Sandstone. Well depths are feet below 700 ft datum.  Figure
13. Enlargement of structure map in Figure 12, showing detail of
Ordovician Wilcox structure.
Figure
13. Enlargement of structure map in Figure 12, showing detail of
Ordovician Wilcox structure.  Figure
14. Ordovician Wilcox structure map from well depths compared to two
Figure
14. Ordovician Wilcox structure map from well depths compared to two
 Figure
17. Seismic tracking, utilizing
Figure
17. Seismic tracking, utilizing  Figure
18. Seismic tracking, illustrated by 3-D auto-tracking of events.
Figure
18. Seismic tracking, illustrated by 3-D auto-tracking of events. Figure
19. Seismic tracking, illustrated by seismic profile with tracked events
and overlay of
Figure
19. Seismic tracking, illustrated by seismic profile with tracked events
and overlay of  Figure
21. Structure map of Ordovician Wilcox structure map, from well and
seismic data.
Figure
21. Structure map of Ordovician Wilcox structure map, from well and
seismic data. Figure
23. 3-D representation of Ordovician Wilcox depth structure.
Figure
23. 3-D representation of Ordovician Wilcox depth structure.