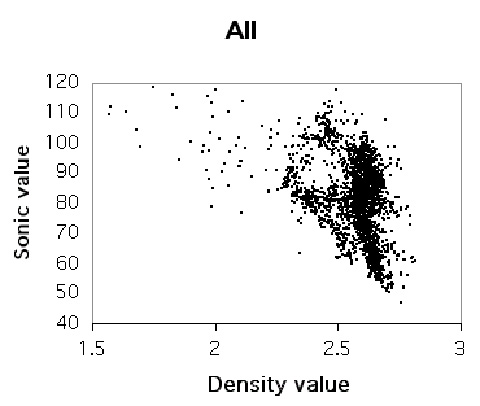
Figure 5. Plot of density vs. sonic values for the entire stratigraphic interval in Self #82 does not show a significant correlation between them.
Figure 5. Plot of density vs. sonic values for the entire stratigraphic interval in Self #82 does not show a significant correlation between them.