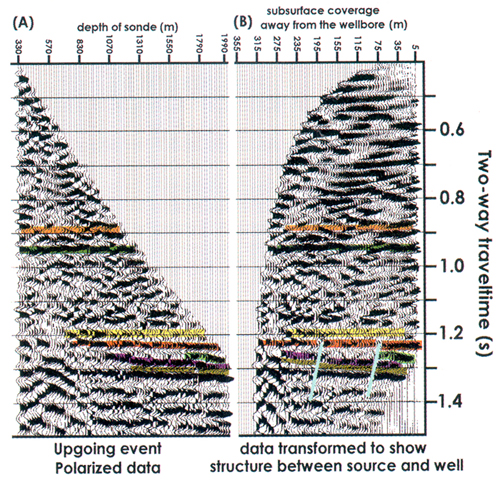
Figure 7. The data in (A) resulted from applying several data polarization steps to the X, Y, and Z data shown in Figure 6. The isolated upgoing event data is plotted in depth of sonde location (trace) versus two-way traveltime. In order to visualize the geology extending from the well laterally towards the source direction, the VSPCDP transformed data is computed and shown in (B). The data show two faults, and the green event truncates against the first fault located approximately 75 meters from the well location.