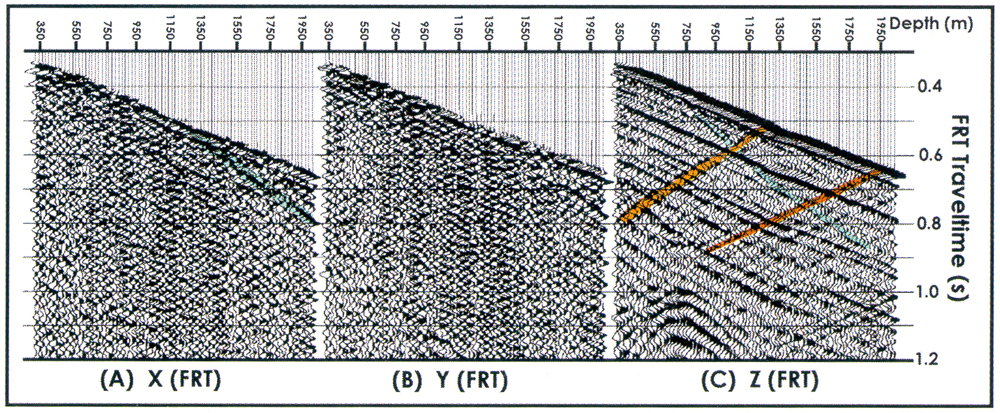
Figure 6. The first break event is found on both the X and Y data. The wavelet is sometimes more consistent on one compared to the other. This is due to the tool rotating in the borehole between tool relocations. The first break event in (A) is the primary downgoing P- or compressional wave. A mode-converted SV or shear event is highlighted in blue in panels (A) and (C). This event dips in a different direction than the downgoing P event because of its slower velocity. In panel (C), the P-wave up- and downgoing events are easily recognized. Note that near the bottom of the data panel there is a hyperbolic-shaped event which could be a refracted shear at the 750 m interface.