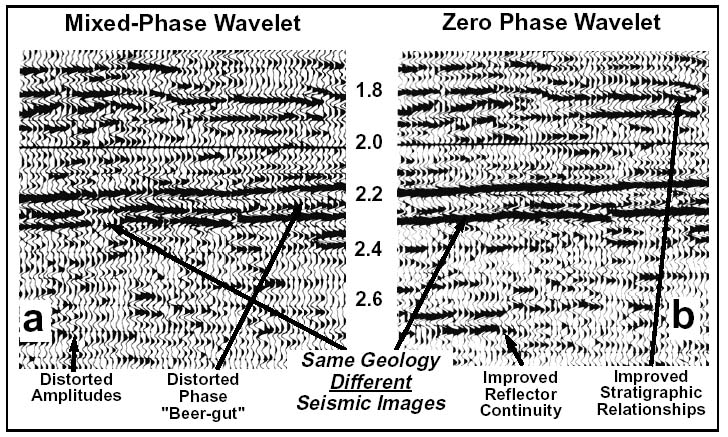
Figure 9. Enlargement of corresponding parts in upper left of Figures 7 and 8, showing significantly different seismic images from the same subsurface geology. The zero phase (b) seismic data not only “looks” better, but also provides a more accurate image. Mixed-phase wavelets distort the seismic image and can lead to incorrect interpretations.