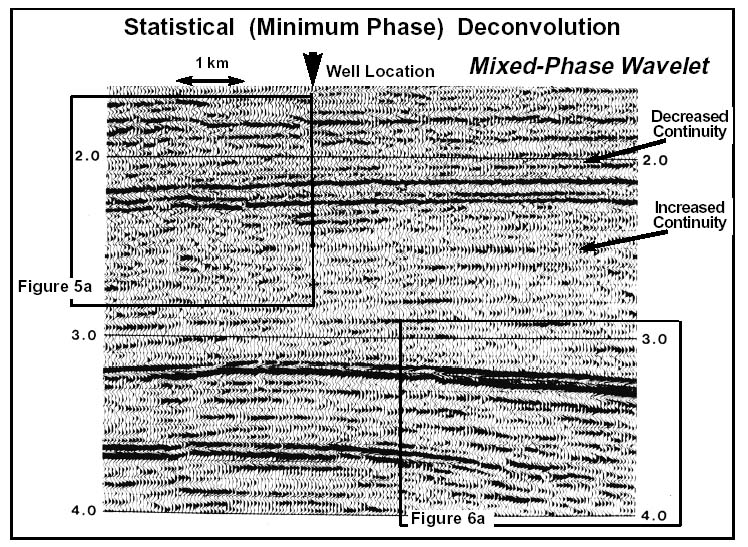
Figure 7. Seismic data identical to Figure 8 other than the method of deconvolution, Statistical. This seismic data contains the mixed-phase wavelet of Fgure 5a. The “Pinocchio with a “beer-gut” character can be seen as the trailing low frequencies beneath the high amplitude reflectors. Mixed-phase wavelets reduces the ability to accurately resolve the subsurface geology.