![]() Click to view images shown during oral presentation
in China, May, 2002.
Click to view images shown during oral presentation
in China, May, 2002.
Development Case Study of a Karsted Carbonate “Island” Hydrocarbon Reservoir: West Carney Hunton Field, Oklahoma*
By
James R. Derby1, F. Joe Podpechan2, Jason Andrews3, and Sandeep Ramakrishna4
Search and Discovery Article #20008 (20002)
1Consulting geologist, Tulsa, Oklahoma ([email protected])
2Independent geologist, Tulsa, Oklahoma ([email protected])
3Independent geologist, Tulsa, Oklahoma ([email protected])
4University of Tulsa ([email protected])
West Carney Hunton Field (WCHF) produces oil and gas from the Silurian Hunton Formation or Group, a carbonate unit lying between the Ordovician Sylvan Shale below, and the Upper Devonian Woodford Shale above. Field production history is complicated by early production of water with hydrocarbons and an unusual distribution of dolomite and limestone across the field area. As large quantities of water are produced, reservoir pressure drops, produced water volume decreases, and volume of hydrocarbons produced increases. Distribution of porosity types, lithologies, and production is best understood by a model for two distinctly different reservoirs in the same stratigraphic horizon and of slightly different geologic ages.
The geologically older reservoir occupies the center of the field. It is composed of vuggy, open-marine, brachiopod biostromes and crinoid/coral packstones and wackestones developed in the Cochrane Formation. Following deposition, the Cochrane was exposed and eroded, leaving an irregular topographic highland or island in the subsequent Silurian sea. The younger reservoir, the Clarita Formation, is developed lateral to, as well as over, this “island”. The Clarita is a dolomite or partly dolomitized limestone that formed in a shallow-water to sabkha setting. The two reservoirs have different production characteristics and pressure regimes. The principal producing zones are dependent initially on the depositional facies of the “island” and its flanking sediments, followed by subaerial exposure, weathering, and karst development. Fracturing and faulting contemporaneous with exposure, karst dissolution, cave development, and collapse have combined with later tectonic faulting to create compartments of hydrocarbon accumulation that cut across the depositional and diagenetic reservoir types. Further, fluid saturation and production characteristics across the field have been altered by the structural history that includes at least two directions of regional tilting subsequent to deposition. At the time of hydrocarbon generation and migration the dip was to the east, and WCHF was on or near the crest of a broad arch. The Hunton Group in this paleo-trap likely was entirely filled with hydrocarbons by mid–Mesozoic time and constituted a giant gas and oil field. Tilting to the southwest and associated faulting (along reactivated faults in the Nemaha system), probably in Jurassic time, would have allowed hydrocarbons to escape and water to enter the reservoir. Finally, another complexity is the presence of the Woodford Shale source rock immediately overlying the Hunton. It is clear that pore geometries at the interface between the source and reservoir rocks are critical to hydrocarbon emplacement.
This study is valuable because excellent core, wireline-log, and paleontologic control document the compartmentalization previously misunderstood, using simple mapping of gross lithologic units and productivity tests of exploration wells. Simulation models for field performance are being modified after carefully studying the cross-calibrated information.
Lessons to be learned from this study are that WCHF are:
1. A Subtle Trap – there is no structural closure, and no obvious facies change to create a stratigraphic trap.
2. Thermally Submature – the Woodford source rock in the area of the field is not considerably beyond the threshold for the “oil window” of thermal maturity.
3. A By-Passed Field – first developed in Hunton in 1996, superimposed on a much older Ordovician “2nd Wilcox” (Simpson) field.
4. Easily Overlooked – initial production is typically 100% water!
5. Beneath, not above, the Principal Source Rock.
6. Example of Differential Entrapment – Hydrocarbons are trapped in low-permeabilty oil-wet matrix pore system; high permeability system is water-filled.
7. Complex and heterogeneous in both sedimentary facies and porosity systems.
|
|
Click here for sequence of phases of depositional history.
IntroductionThe West Carney Hunton Field (WCHF) is located in Logan and Lincoln counties in north-central Oklahoma in T14N-T16N, R1E-R3E (Figure 1). The field is in an area generally described as the Central Oklahoma Platform or Eastern Oklahoma Shelf; a structural element bounded by the Nemaha Range immediately to the west, the Ozark Uplift to the east and northeast, the Hunton-Pauls Valley Uplift to the south, and the Arbuckle Uplift and Arkoma Basin to the south and east (Figure 2). This location was on the northeast flank of the Oklahoma Basin (Figure 3) during deposition of the Hunton but was separated from the deeper part of the basin by the Nemaha Uplift during Pennsylvanian time. The field produces oil and gas from the Hunton Group, which is a major target for petroleum exploration in the southern Midcontinent. Stratigraphically, the Hunton Group lies between the subjacent Sylvan Shale and the superjacent Woodford Shale (Figure 4). The West Carney Hunton Field is located about 6 miles southwest of the truncated edge of the Hunton beneath the Woodford Formation (Figure 2). The Hunton crops out only in eastern Oklahoma, on the flanks of the Ozark Uplift, and in southern Oklahoma, in the Arbuckle Mountain complex. Because of its limited exposure and its distance from the study area, understanding the Hunton Group in north-central Oklahoma must be obtained from study of core data and wireline logs, types of data for which this study has exceptional control. Development of West Carney Hunton Field began in 1996, when Altex Resources placed the Decker # 1 (NE Sec.1, T15N, R2E) on a large beam pump and soon realized that large quantities of oil and gas could be produced by moving larger amounts of water. Four companies operate a majority of the wells in the field: Altex Resources, New Dominion, Craig Elder, and Marjo Operating Company. The field, which covers nearly 30,000 acres, currently has more than 230 producing wells and 16 saltwater disposal wells. The field produces an average of 6000 barrels of oil, 55,000 MCF gas, and 86,000 barrels of water daily. In 1999, the U.S. Department of Energy, National Petroleum Technology Office awarded Contract DE-FC26-00BC15125 to the University of Tulsa Department of Petroleum Engineering, Dr. Mohan Kelkar, Project Director, for a study of the “Exploitation and Optimization of Reservoir Performance in Hunton Formation, Oklahoma”. Participating in the study are Marjo Operating Company, Inc. and Joe Podpechan, as the operating company, Dr. Kishore Mohanty, University of Houston, who performs special core analyses, graduate students in the Department of Petroleum Engineering, University of Tulsa, and Dr. James R. Derby, Consultant. Dan Ferguson, U.S. DOE National Petroleum Technology Office, Tulsa, Oklahoma, is the Project Manager. This report focuses on a geological description of the reservoir based on core descriptions by Derby and Ramakrishna, and regional correlation and mapping by Podpechan. Podpechan and Derby have cut most of samples for paleoanalysis and thin-sections. Derby and Andrews wrote this report, and Andrews prepared most of the illustrations. This study is unusual in the abundance of data available. Over 500 wells have penetrated the Hunton in the field; many were drilled to the underlying Ordovician “Wilcox” (Simpson Group) in an earlier, deeper play. Twenty-seven cores are currently available for study. Marjo cores every well it drills. Cores of either the entire Hunton or as much of the Hunton that could be recovered in two 60-ft. core barrels have been cut in 27 wells. Cores are routinely slabbed, photographed, and analyzed by Stim Lab. Fourteen wells have been described in detail. Descriptions of these wells are available in the project’s Budget Period 1 Report, which may be obtained from the DOE office in Tulsa. Biostratigraphic age determinations from conodont studies by Dr. James Barrick of Texas Tech University provides control on correlations and formation assignment, based on samples from 8 wells. Although production techniques and engineering are part of this overall study, those topics will not be discussed in detail here. David Chernicky and Scott Schad of New Dominion described production techniques in an Oklahoma Geological Survey workshop in May, 2002. Vineet Marwah, University of Tulsa Department of Petroleum Engineering, recently presented an interpretation of the primary production mechanism of part of the field (in his M.S. thesis). Engineers in this research project presented two papers on the Hunton reservoir and production at the SPE/DOE Symposium on Improved Oil Recovery, April 13-17, 2002, in Tulsa. This study and the high level of interest concerning it were prompted, at least in part, by the unique production characteristics of the field. When initially completed, wells in the field produce large amounts of water with a relatively low oil-and-gas cut. As the water within the reservoir is pumped, the gas volume slowly begins to increase, followed by an increase in oil cut (Figure 5). Within a few days to a few months, depending on several factors, the typical well represents a profitable venture. The purpose of this work is to develop a geological understanding of the Hunton Group in the West Carney Hunton Field, especially in relation to optimizing reservoir performance and exploitation of the Hunton reservoir. When faced with large initial water rates associated with producing from this type of reservoir, most oil and gas companies would cease operation before significant oil and gas production is realized, resulting in a field of this nature being bypassed. Alternatively, it is important to identify and define the unique characteristics of this type of reservoir in order to avoid the economic disaster caused by operators completing and pumping every new well with the mistaken hope that commercial production will result, when in fact, the reservoir is “wet” in the conventional sense, and producible oil is not present. Understanding the geology related to the reservoir in the West Carney Hunton Field may help in the early assessment of other similar type reservoirs elsewhere. StratigraphyThe stratigraphic section in the West Carney area is shown in Figure 4. Units both above and below the Hunton Group are expressed in terms of general lithology, age, and thickness. Permian strata crop out within the study area. Depth to the Hunton Group in the field averages about 5000 ft. Numerous formations in the Pennsylvanian produce oil in the area. The Ordovician Bromide sand (“Second Wilcox”) also is a major petroleum producer in the area and the target of most wells that fully penetrate the Hunton strata. Although the Arbuckle dolomite does not produce oil and gas in the area, it is an excellent zone for the disposal of salt water. The interval of specific interest in the West Carney Hunton Field is as follows: Woodford Formation--a black shale and rich source rock. The Woodford is reported to be the source of 70% of the oil produced in Oklahoma (Comer and Hinch, 1987). Hunton Group--a shallow-shelf carbonate of latest Ordovician through Middle Devonian age. Detailed subdivisions of the Hunton Group are shown in Figure 6. Only the Lower Silurian portion has been recognized in WCHF. Sylvan formation--a gray-green marine shale, commonly containing graptolites, suggesting that it was deposited in relatively deep water, below storm wave base. The litho- and time-stratigraphic diagram of the Hunton Group in Oklahoma prepared by Stanley (2001) is shown in Figure 6. This diagram shows the biostratigraphic correlation of global conodont biozones and North American brachiopod biozones with the fauna in the rock units of the Hunton Group in Oklahoma. The Hunton Group ranges in age from latest Ordovician (Hirnantian substage, Ashgillian stage ), about 440 Ma, to Middle Devonian, 380 Ma; a time span of approximately 60 million years. The Hunton Group in Oklahoma is generally in conformable contact with the subjacent Sylvan shale, and in unconformable contact with the Woodford Shale above. As determined from conodont studies, the entire West Carney field is composed of the Cochrane and Clarita formations of the Chimney Hill Subgroup; representing an estimated 10 million years, or only 16% of total “Hunton time”. There is no present evidence for the presence of the basal Keel Formation or for the Henryhouse, Bois d’Arc, or Frisco formations above the Chimney Hill. Therefore, within the West Carney field, the Hunton Group is in unconformable relationship with both the underlying Sylvan Shale and the overlying Woodford Shale. The hiatus above the Clarita and/or Cochrane Formations in the field, accounts for some 50 million years of time during which sediment was either never deposited, or if deposited, subsequently eroded. Structural SettingWCHF lies along the northern flanks of the Paleozoic Oklahoma Basin (Figure 3). The strata deposited in most parts of the Oklahoma Basin are widespread and laterally persistent, indicating the relative tectonic and orogenic stability of the region during Early Paleozoic. The Hunton Group was deposited in a broad, shallow epicontinental sea, with depositional slope toward the southwestward into the more rapidly subsiding Southern Oklahoma Aulacogen. This southwest dip was accentuated in Late Devonian (pre-Woodford) time with uplift of the broad Chautauqua Arch (Figure 3). Before deposition of Pennsylvanian beds, there was truncation of the Mississippian, Woodford, and Hunton in the WCHF area; based on subcrop patterns (Jordan, 1962), the general area was gently tilted east-southeastward, in response to the cumulative effects of the Nemaha Uplift to the west and the Arkoma Basin to the east and southeast. The eastward tilting apparently continued throughout the remainder of Paleozoic, as evidenced by the east-southeast thickening of about 10 ft. per mile of the Pennsylvanian sequence (cf. Levorsen, 1967, p. 543). The area was subsequently tilted southwestward during the Mesozoic (probably Jurassic), resulting in a modern structural dip of about 45 ft. per mile southwestward (Figure 7). This structural scenario is complicated by tectonic movements and selective erosion affecting the Carney area both prior to and following Hunton deposition. A regional thin in the Viola in WCHF area suggests that the area may have been affected by a slight paleotopographic high prior to and during Hunton time. Possibly the absence of Keel in the field is due to nondeposition, or deposition and subsequent erosion over this “high.” The distribution and thickness of the Clarita, relative to the Lower and Upper Cochrane (Figures 7 and 8), suggest some Early Silurian paleostructural influence. Post-Hunton structural movements in the area are evidenced by the presence of faults that did not affect Hunton thickness but did affect the thickness of the Mississippian (Figure 9). However, post-Hunton - pre-Woodford activity in the general area may have occurred, as evidenced by erosion of the Hunton along the Seminole Uplift and local areas of “zero Hunton” both southeast and northeast of WCHF as shown by Amsden (1975, pl. 9) (Figure 10). Depositional HistoryThe rock units of the Hunton Group in WCHF, and throughout all of Oklahoma, suggest a depositional history of episodic cycles of deposition and erosion (Figures 6, 11), related to worldwide sea-level, oceanic, and climatic events (Jeppsson, 1998; Barrick, 2001). The Chimney Hill Subgroup, in ascending order, is composed of the Keel, Cochrane, and Clarita formations (Figure 6). The generally oolitic limestone comprising the Keel, latest Ordovician (Ashgillian) to early Silurian (Llandoverian) in age, appears to be absent in WCHF. Therefore, the relationship between the top of the Sylvan Shale, and the base of the Cochrane Formation in the Carney area is unconformable. In WCHF the Cochrane Formation consists of a variety of fossiliferous, open-marine limestone facies. Conodont data, in combination with the relative stratigraphic position of the rock units, indicate that a widespread Lower Cochrane unit is unconformably overlain locally by an Upper Cochrane unit. Within WCHF, the Cochrane Formation is composed of a central fossiliferous limestone macrofacies, flanked by a nonporous mudstone facies (Figures 7, 11), the age of which has not yet been confirmed by paleontology. Deposition of the upper Cochrane Formation was followed by a fall in relative sea level, during which the Cochrane was eroded differentially. Seemingly, the fossiliferous limestone macrofacies in the center part of the field (Figure 7), was more resistive to erosion than the nonporous mudstone facies on the flanks of the field, with the result being a topographic high composed of the fossiliferous Cochrane limestone (Figure 11B). When relative sea level began to rise again, the Clarita Formation was deposited across the area (Figure 11C), and relatively thick sequences of Clarita, generally a shoal-water dolomite or dolomitized limestone, are present on the east and west sides of the field, where the Clarita was deposited in the post-Cochrane paleotopographically lower areas. The Clarita Formation is the youngest unit of the Hunton Group present in the West Carney Hunton Field. The hiatus between the Clarita and the Woodford represents approximately 50 million years. Although the depositional history represented by this hiatus is purely speculative, regional studies of the Hunton suggest that at least the Henryhouse Formation, if not the Haragan-Bois d’Arc and the apparently widespread but rarely preserved Frisco Formation, was deposited across the field (Figure 10). As explained by numerous authors, each of these formations is unconformity-bounded, and some contain numerous sequences that are also unconformity bounded. The final episode (of the multiple episodes) of deposition and erosion that followed deposition of the Clarita Formation was a sea-level lowstand and a long period of erosion and subaerial exposure during the 10 million years between the deposition of the youngest Hunton and onset of Misener/Woodford deposition. Extensive karst development, including multiple generations of cross-cutting karst dissolution and sedimentation, is evident in nearly every core of the field, from the top to the base of the Hunton (in numerous cases), suggesting complete emergence during sea level lowstands. After the final episode of erosion and subaerial exposure during Hunton time, relative sea level rose again, resulting in deposition of the Woodford Shale across the region. In the West Carney Hunton Field, the Woodford was deposited uniformly across most of the field, but it is exceptionally thick where the subjacent Cochrane Formation has been incised (where Clarita is absent) (Figure 11E). The Woodford Shale is considered to be the primary source rock for oil and gas accumulations within the Hunton reservoir, with perhaps minor amounts of hydrocarbons derived from the Sylvan Shale. In WCHF, the Woodford Shale may have achieved the threshold depth of burial for oil generation by the end of Permian time. In fact, the depth of burial was likely greater, as an unknown amount of Permian and Mesozoic strata have been eroded from the region. The Woodford in the area attained an early-oil-generation stage, based on vitrinite reflectance (Figure 12 [Comer, 1992, Fig. 13]). Higher thermal maturity values are present eastward, reflecting the eastward thickening of post-Woodford strata. By mid-Mesozoic time oil and gas generated east of WCHF would have migrated updip to the west, possibly filling reservoirs in WCHF area. The subsequent southwest tilting would have altered the reservoir configuration, possibly partially breaching the seal, allowing water to invade a previously oil- and gas-filled reservoir, leading to the complex conditions observed today. ProductionThe Hunton Group in WCHF produces oil and gas from the Cochrane and Clarita formations of the Chimney Hill Subgroup. The reservoir ranges from 24 to 146 ft. thick throughout the area. A gentle homoclinal dip of approximately 40-45 ft. per mile to the southwest; little to no structural closure (Figure 7) suggest a stratigraphic mechanism of entrapment. The producing part of the field is currently thought to be approximately 30,000 acres. The field now has around 230 producing wells and 16 saltwater disposal wells. All saltwater disposal wells are open-hole completed in the Arbuckle dolomite, which is nearly 2000 ft. thick. Approximately 50 (22%) of Hunton wells are located in those parts of the field composed primarily of dolomite facies, whereas approximately 180 (78%) wells produce from the Hunton limestone macrofacies (Figure 7). Eight horizontal wells have been drilled and completed in the West Carney Hunton Field. Relative economic success of horizontal wells compared with “straight-hole” (vertical) wells has yet to be determined; however, early indications are encouraging. The field currently produces 6000 barrels of oil per day, 55,000 MCF gas per day, and 86,000 barrels of water per day. An average well will produce 26 barrels of oil per day, 239 MCF gas per day, and 374 barrels of water per day. An exceptional well produces in excess of 100 barrels of oil per day, 0.5 to 1 million cubic ft. of gas per day, and in excess of 1500 barrels of water per day. The average recovery per well is expected to be nearly 50,000 barrels oil, and 350,000 MCF gas. Volumetric calculations from wireline logs indicate that approximately 5% of the oil in place is expected to be recovered before enhanced procedures are introduced. One of the goals of this study is to suggest ways to optimize reservoir performance and increase the percentage of recoverable hydrocarbons. WCHF unique production characteristics include the heterogeneous nature of the field, prohibiting the use of the term “typical” in reference to any single well. However, wells generally perform in the following manner: 1. Wells produce large initial water rate with low oil-and-gas cut. 2. The rate of gas production increases within a few days. 3. Finally, the rate of oil production increases (Figure 5). The heterogeneity of the field may contribute to this behavior. The Hunton reservoir rock within WCHF is thought to have a dual permeability system: a higher permeability component consisting of “touching vugs” (Lucia, 1995) and solution-enhanced fractures, and a lower permeability component consisting of microporosity and intercrystalline porosity. At this time, the fluids are thought to move readily through the higher permeability component; however, more hydrocarbons are stored in the lower permeability component. As a result, wells when initially completed produce large quantities of water with a relatively low oil-and-gas cut, indicating that the higher permeability component of the dual porosity system is being “flushed.” Eventually enough of the fluid contained in the higher permeability component is removed to create a pressure differential between the low and high components of the dual permeability system. As a pressure differential develops, fluid contained within the microporosity of the low permeability system mobilizes and moves from an area of high pressure to an area of low pressure; thus, it “bleeds” into the high permeability component of the system. When the fluid reaches the higher permeability component, it becomes recoverable. Gas, because of its lower viscosity, is more readily moved than oil, as reflected by the increase in the production of gas prior to the production of oil. As the gas-and-oil cut slowly increases, the well becomes commercial, and hopefully profitable. Moving and disposing of such large amounts of water is a costly endeavor. The drilling of saltwater disposal wells, a necessity in the area, costs between $450,000 to $600,000 each. This “upfront” expenditure is needed before substantial production can begin. A producing well costs between $400,000 and $500,000 and costs an additional $2,000 to $6,000 each month to operate. On average, the return on investment is between 2:1 and 3:1, depending significantly on oil and gas prices. Early in the project, the operating company, Marjo Operating Company, Inc., determined that coring the Hunton in every well provided the best data for the most meaningful analysis. To date, 27 wells have been cored (Figure 8). Marjo’s methodology is to run two 60-ft. core barrels and take whatever core can be recovered in those two runs. Stim Lab of Duncan, Oklahoma, upon receipt of each core, performs the following:
These data and the well-log data, typically gamma-ray, neutron-density, and resistivity logs, are made available to the geologist. Prior to description of the core a core/log comparison sheet is prepared, with the core-derived porosity, permeability, and grain density values depth-adjusted and plotted adjacent to the corresponding depths of the petrophysical well logs. This depth adjustment is critical to the log analysis and engineering studies that follow. During a preliminary study of each core, samples are cut for petrographic thin-sections, and for paleontologic (conodont) analysis. Prior to detailed description of a core, it is desirable to have at least a preliminary description of each sample in thin-section in order to identify grain types and diagenetic fabrics accurately. These microscopic data are entered on the data sheets as a guide to accurate macroscopic recognition of pore types, grain types, and facies (Kelkar, 2002). . During core description, each analyzed interval is assigned a porosity-type code and a facies code. The core is also described in conventional lithogenetic or sedimentological units, and principal porosity types are identified. Because secondary porosity is so significant in the Hunton reservoir, the pore classification of Lucia (1995) is utilized and the percentage of touching vugs is estimated for each described interval (Kelkar, 2002). Finally, the karst features, stylolites, and fractures of each core are described separately. FaciesIn the fourteen wells described to date, 11 distinct lithofacies have been identified in the Hunton , as well as 3 non-Hunton lithofacies. Some of these facies are illustrated in the Appendix. Preliminary studies of the additional cores suggest that additional lithofacies are present. In most cases, the original depositional lithofacies can be identified regardless of the degree of dolomitization. All facies can be recognized in limestone, partially dolomitized limestone, and dolomite, if the allochems are recognizable. Facies #2 is the descriptor for completely recrystallized or totally crystalline rock in which no precursor sediment is recognizable. Distinction is made between limestone, partially dolomitized limestone, and dolomite. Numeric codes for 14 identified lithofacies
Stratigraphic Correlation and Facies Interpretation Initial attempts at stratigraphic correlation of WCHF lithofacies yielded unsatisfactory results because of what appears to be very abrupt lateral changes in facies. The addition of paleontological data provided recognition that WCHF stratigraphy consists of three separate sequences, with major topographic relief at the unconformities. An east-west cross-section (Figure 13) shows over 100 ft. of deeply eroded Lower Cochrane overlain by an Upper Cochrane sequence, which in turn is deeply eroded and overlain by a Clarita sequence. Seven conodont zones have been recognized in Upper Ordovican and Silurian strata in WCHF. Conodont identifications and interpretations, provided by Dr. James Barrick, Texas Tech University, are in the Appendix of the DOE BP1Report (Kelkar, 2002). Lithofacies relations between wells, as shown in the 6-well cross-section (Figure 13), are interpreted, using the classification of Johnson et al. (1997) (Figure 14), in terms of Silurian benthic assemblages (BA) on an open-marine shelf. The big pentamerid brachiopod assemblage (facies 7) is diagnostic for benthic assemblage 3, with suggested water depths of 30 to 60 meters (in the middle part of the shallow shelf). This facies is locally more than 60 ft. thick and locally is an excellent reservoir rock, with large vugs between the equally large brachiopod shells. However, these vugs may be occluded with karst infill and diagenetic cements, resulting in a poor reservoir. The coral-, stromatoporoid-, and crinoid-dominated facies (4,5,6,8,9), also common in the Cochrane, suggest a BA 2, or upper shallow shelf position, in water depths of 10 to 30 meters. Therefore, almost all of the Cochrane units described can be interpreted as middle to upper-middle shallow-shelf depositional environments. This lithofacies and macrofossil environmental interpretation are supported by the conodont data (Kelkar, 2002). One of the interesting results from this study is that in contrast to the “layer-cake” stratigraphy characteristic of peritidal settings, the lateral relationships of WCHF facies, shown in Figure 13, demonstrate extensive heterogeneity. Large brachiopod biostromes (shell mound accumulations) grade laterally, in some cases in less than one mile, to crinoidal grainstones or to coral or stromatoporoid-dominated wackestones. In contrast to the Cochrane described above, the Clarita is dominated by dolomitized fine grainstones and some fine mudstones with sedimentary features suggestive of shoal to intermittently emergent conditions (BA 1). The geographically abrupt lateral transition from BA 3 (in the Cochrane) to BA 1 (in the Clarita) is extremely unlikely, and this study shows that they represent two separate depositional events. Recognition of these two distinctly different sequences allows the logs to be correlated and interpreted, as illustrated in Figures 15 and 16. Confirmation of this interpretation is based on conodont data from the Griffen well on the west side of the field, where dolomitized grainstones contain microfauna characteristic of the Clarita. Paleoenvironmental interpretation of the Clarita remains problematic. The mix of lithofacies, including fine to medium crinoidal and small-brachiopod wackestones, packstones, and grainstones, all suggest a very shallow-water, moderately high-energy environment. A few beds of mudstone with sub-horizontal mottles suggest sabkha conditions. The overprint of early karst and early dolomitization also suggests a shoal to emergent environment; namely, BA 1. In contrast, the contained conodont fauna is a deep-water open-marine fauna consistent with the fact that the Wenlockian transgression is one of strongest and most extensive Silurian sea level rises (Jeppsson, 1998). The apparent conflict between observed lithofacies and apparent biofacies probably reflects the allogenic nature of the packstones and grainstones in addition to sea-level change(s) during and after deposition of the Clarita. Thicker parts of the Lower and Upper Cochrane (Figures 13, 17) probably reflect an emergent island surrounded by shallow sea. PorosityPorosity TypesPorosity development in the Chimneyhill Subgroup in WCHF is a combination of original sediment type and diagnesis. Most of the sediment is so severely altered by early to middle diagenesis that original sediment type no longer is a factor. For example, much of the section is coarse grainstone, but most coarse grainstones are so strongly affected by early dissolution that the grainstone fabric is totally collapsed into a tight matrix of coarse, inter-sutured grains with virtually no fine matrix or secondary spar. Other grainstones are more conventionally filled with porosity-occluding spar or syntaxial overgrowths. Pelmatozoan (“crinoid”) grains are especially subject to development of syntaxial overgrowths that totally occlude any effective porosity. In many Hunton packstones, effective porosity is developed only as result of dissolution of fine carbonate mud matrix. A classification of porosity types for this study is given below. This is simply an ad hoc listing of porosity types encountered so far and does not preclude recognition of other types in the future. Each sample analyzed by Stim Lab is assigned a porosity code, providing a ft.-by-ft. description of the reservoir. Many of these porosity code assignments may be modified in the future by more detailed information resulting from thin-section or acetate-peel analysis of selected intervals. Porosity types (Figures 17 and 18) are: 1. Interconnected Vuggy porosity Vuggy or Moldic, with intergranular, solution-enlarged fracture, or other connection. Touching vugs in general. No vugs in tight matrix. 2. Coarse Matrix porosity Inter-particle, Intergranular or Intercrystalline, in coarse-grained rock, >.25 mm. particle size. Many include dissolution porosity that is inter-particle micro-vugs (dissolution of spar or matrix). 3. Fine Matrix porosity Inter-particle, Intergranular or Intercrystalline, in medium- to fine-grained rocks, <.25 mm. particle size. Includes fine non-touching vugs and non-touching fine Moldic porosity along with intra-particle porosity 4. Fracture Fracture or Solution-enlarged Fracture without significant matrix or vugs. For this study, includes solution-enhanced fractures with sand in-fill. 5. Vuggy or Moldic in coarse crystalline (intercrystaline) matrix (> .25 mm) 6. Coarse crystalline with Intercrystalline porosity (> .25 mm) 7. Medium to fine crystalline (Intercrystalline) (.25 mm to .02 mm) 8. Fracture or Solution-Enlarged Fracture without significant matrix porosity 9. Interconnected Vuggy porosity Vuggy or Moldic with Intergranular, Solution-enlarged fractures or other connection. Touching vugs in general. No vugs with tight matrix. 10. Coarse Matrix porosity Inter-particle, Intergranular or Intercrystalline of coarse-grained rock, >.25 mm particle size. May include dissolution porosity that is inter-particle micro-vugs (dissolution of spar or matrix). 11. Fine Matrix porosity Inter-particle, Intergranular or Intercrystalline of medium to fine-grained rocks, <.25 mm particle size. Includes fine non-touching vugs and non-touching fine Moldic (MO) porosity along with intra-particle porosity 12. Fracture Fracture or Solution-enlarged Fracture without significant matrix or interconnected vuggy porosity. For this study, includes solution-enhanced fractures with sand in-fill. Distribution of Pore types Figure 17 illustrates the vertical and lateral distribution of pore types in a 6-well cross-section. It demonstrates that the reservoir is extremely heterogeneous both vertically and laterally, with no individual flow-units creating neat geometric compartments of reservoir types. Modeling of the reservoir must accommodate this known heterogeneity.
Log Interpretation of Porosity Comparison of core porosity and log porosity indicates that the Neutron-Density cross-plot (derived average porosity) correlates best with measured core data in a majority of the wells sampled (Figure 19). KarstKarst features are present in all cored wells, but the nature of the karst is highly variable between wells. Development of karst and its effects on potential reservoirs are well illustrated by Loucks (1999). The features illustrated are abundantly present in WCHF cores and are listed in each well core description under the part designated for karst features. Effects of karstification range from open fractures extending through the entire Hunton and thick collapse breccias, with steeply dipping beds, to minor fracture (crackle or mosaic) breccia and vuggy porosity. One well, Houser 1-11 (Figure A-7), shows evidence of a cave 11 ft. high, completely filled with a combination of collapse breccia, cavern-fill parabreccia, and laminated void-filling silt. The abundance of collapse breccias suggests that Hunton thickness in WCHF may have been significantly affected by karst. Karst sediments range from medium sand to clay that fills open fractures, caverns, vugs, inter-particle space in collapse breccias, and intra-fossil cavities. Karst sediments may occlude porosity and reduce permeability, at least as recognized by core analysis. For example, Marjo Operating Company, Inc. Joe Givens #1-15 (sec. 15, T15N, R2E) is extensively karsted, with sand-filled fractures extending to the base of the Hunton; however, it shows very poor porosity on both well logs and core analysis. (Some of the karst passages are obviously not filled, as the Joe Givens #1-15 has a high fluid flow and is one of the better producers.) Engineering data and drilling experience clearly show that open karst channels interconnect the wells. Marjo Operating Company, Inc. Geneva #2-32 (NE-SW sec. 32, T16N, R3E) was being drilled in January, 2001, when it lost circulation while coring and pumped in Lost Circulation Material (LCM). A nearby operator was swab-testing the Altex Covey Heirs #3-32 (SE-NW sec. 32, T16N, R3E) 1320 ft. away from the Geneva #2-32 and almost immediately recovered the LCM in their swab test. Formation pressure data has also verified the free interconnection between some wells. At this time we have not yet attempted to create an appropriate model for karst channels in WCHF, as is clearly needed to simulate fluid flow through karst channels. ConclusionThis study remains a “work in progress” during a 5-year study. From the evidence presented, it is obvious that the Hunton in WCHF is a complex, heterogeneous reservoir with an intricate geological history. We strongly suspect that the unique production characteristics of the field are the result of an interaction between the complex pore structure and flow units with the complex fluid migration caused by paleostructural activity. Future work involves refining and verifying the geological interpretation presented, and integrating geological data with engineering data to analyze and characterize petrophysical flow units of the reservoir. Selected BibliographyArchie, G.E., 1952, Classification of carbonate reservoir rocks and petrophysical considerations: AAPG Bulletin, v. 36, no. 2, p. 278-298Amsden, , T.W., 1980, Hunton Group (Late Ordovician, Silurian, and Early Devonian) in the Arkoma Basin of Oklahoma: Oklahoma Geological Survey Bulletin 129, 136 p., 16 pl.. Barrick, J.E., 2001, Conodont biofacies and biostratigraphy of Silurian strata of the Hunton Group in Oklahoma, and equivalent units in west Texas and eastern New Mexico, in Johnson, K.S. (ed.), Silurian, Devonian, and Mississippian geology and petroleum in the southern Midcontinent, 1999 Symposium: Oklahoma Geological survey Circular 105, p. 169. Choquette, P.W., and L.C. Pray, 1970, Geological nomenclature and classification of porosity in sedimentary carbonates: AAPG Bulletin, v. 54, no. 2, p. 207-250. Comer, J.B., 1992, Organic geochemistry and paleogeography of Upper Devonian Formations in Oklahoma and northwestern Arkansas, Oklahoma Geological Survey Circular 93, p. 70-93, in Johnson, K.S., and Cardott, B.J., (eds) 1992, Source Rocks in the Southern Midcontinent, 1990 Symposium: Oklahoma Geological Survey Circular 93, 352 p. Comer, J.B., and Hinch, H.H., 1987, Recognizing and quantifying expulsion of oil from the Woodford Formation and age-equivalent rocks in Oklahoma and Arkansas: AAPG Bulletin, v. 71, p. 844-858. Dunham, R.J., Classification of carbonate rocks according to depositional texture, in W.E. Ham, ed., Classification of carbonate rocks—a symposium: AAPG Memoir 1, p. 108-121. Fritz, R. D., 1978, Structural contour map of Oklahoma on the Pennsylvanian Wapanucka Limestone: Unpublished Master of Science Thesis, Oklahoma State University. Jeppsson, L., 1998, Silurian oceanic events: Summary of general characteristics: in Landing, E. and Johnson, M., (eds.), Silurian cycles: Linkages of dynamic stratigraphy with atmospheric, oceanic, and tectonic changes: New York State Museum Bulletin 491, p. 239-257. Johnson, M.E., 1987, Extent and bathymetry of North American platform seas in the Early Silurian: Paleoceanography, v. 2, no. 2, p. 185-211. Johnson, M.E., Y.I. Tesakov, N.N. Predtetchensky, and B.G. Baarli, 1997, Comparison of Lower Silurian shores and shelves in North America and Siberia: Geological Society of America Special Paper 321, p. 23-45. Johnson, K.S, 1989, Geologic evolution of the Anadarko Basin: in Johnson, K.S. ed., Anadarko Basin Symposium - 1988, Oklahoma Geological Survey Circular 90 (1989) p. 3-12. Johnson , K. S, et al., 1988, Southern Midcontinent Region, in Sloss, L. L. (ed). Sedimentary cover-North American craton, U. S., The Geology of North America, Geological Society of America, Boulder, v. D-2, p. 307-359. Jordan, L., 1965, Geologic map and section of Pre-Woodford rocks in Oklahoma: Oklahoma Geological Survey Map GM-9. Jordan, L., 1962, Geologic map and section of pre-Pennsylvanian rocks in Oklahoma: Oklahoma Geological Survey Map GM-5. Kelkar, M., 2002, Exploitation and optimiztion of reservoir performance in Hunton Formation, Oklahoma: Final Report, budget period 1 on work performed under contract No. DE-FC26-00BC15125, prepared for the National Energy Technology Laboratory, National Petroleum Technology Office, U.S. Department of Energy, Tulsa, OK, 305 p. Levorsen, A.I., 1967, Geology of petroleum: W.H Freeman Co, San Francisco, California, 724 p. Loucks, R.G., 1999, Paleocave carbonate reservoirs: Origins, burial-depth modifications, spatial complexity, and reservoir implications : AAPG Bulletin , v. 83, p. 1795-1834. Lucia, F.J., 1995, Rock fabric/petrophysical classification of carbonate pore space for reservoir characterization: AAPG Bulletin, v. 79, p. 1275-1300. Rottmann. Kurt, E.A. Beaumont, R.A. Northcutt, Zuhair Al-Shaieb, Jim Puckett, and Paul Blubaugh, 2000, Hunton play in Oklahoma (including Northeast Texas Panhandle): Oklahoma Geological Survey Special Publication 2000-2, 131 p., 6 pls. Stanley, T.M., 2001, Stratigraphy and facies relationships of the Hunton Group, northern Arbuckle Mountains and Lawrence Uplift, Oklahoma: Oklahoma Geological Survey Guidebook 33, 73 p. Photographs of Facies and Karst Features
Click here for sequence of A and B.
Click here for sequence of A and B.
Click here for sequence of A and B.
Click here for sequence of A and B.
|
 Figure 1. Index map for West Carney Hunton
Field (WCHF) in Lincoln and Logan counties, Oklahoma.
Figure 1. Index map for West Carney Hunton
Field (WCHF) in Lincoln and Logan counties, Oklahoma. Figure 3. Tectonic/depositional features in
Oklahoma and environs during Late Paleozoic (After Northcutt and
Johnson, 1997).
Figure 3. Tectonic/depositional features in
Oklahoma and environs during Late Paleozoic (After Northcutt and
Johnson, 1997). Figure 4. Stratigraphic section in the West
Carney area.
Figure 4. Stratigraphic section in the West
Carney area. Figure 6. Stratigraphic column of
Ordovician-Devonian Hunton strata, along with subjacent and overlying
strata. Numerous unconformities are present within the Hunton.
Figure 6. Stratigraphic column of
Ordovician-Devonian Hunton strata, along with subjacent and overlying
strata. Numerous unconformities are present within the Hunton. Figure 7. Hunton facies map with structural
map of WCHF area, on the base of the Hunton Group / top of the Sylvan
Shale. Structural features are represented generally by a southwesterly
dip with north-northeast-trending faults, along with an east-west fault
in the south. Cochrane Formation, dominantly limestone, is flanked to
the east and northeast, as well as to west and southwest by dolomite of
the younger Clarita Formation.
Figure 7. Hunton facies map with structural
map of WCHF area, on the base of the Hunton Group / top of the Sylvan
Shale. Structural features are represented generally by a southwesterly
dip with north-northeast-trending faults, along with an east-west fault
in the south. Cochrane Formation, dominantly limestone, is flanked to
the east and northeast, as well as to west and southwest by dolomite of
the younger Clarita Formation. Figure 8. Isopach map of Hunton Group in WCHF
and locations of cored wells and lines of stratigraphic cross-sections
Figure 8. Isopach map of Hunton Group in WCHF
and locations of cored wells and lines of stratigraphic cross-sections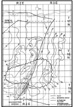 Figure 9. Isopach map of Mississippian strata
in area of WCHF; a thicker section in the downthrown block of a
north-northeast-trending fault indicates structural activity during
deposition.
Figure 9. Isopach map of Mississippian strata
in area of WCHF; a thicker section in the downthrown block of a
north-northeast-trending fault indicates structural activity during
deposition. Figure 10.
Pre-Woodford subcrop map of
Oklahoma (from Amsden, 1975).
Figure 10.
Pre-Woodford subcrop map of
Oklahoma (from Amsden, 1975).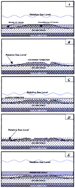 Figure 11. Sequence of diagrammatic east-west
cross-sections, showing the depositional history of the West Carney
Hunton Field.
Figure 11. Sequence of diagrammatic east-west
cross-sections, showing the depositional history of the West Carney
Hunton Field.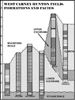 Figure 13. East-west stratigraphic
cross-section of Hunton Group, WCHF, showing formations and carbonate
facies. Location in
Figure 13. East-west stratigraphic
cross-section of Hunton Group, WCHF, showing formations and carbonate
facies. Location in Figure 14. Facies model for Silurian carbonate
“shore” and shelf deposits (after Johnson, 1987).
Figure 14. Facies model for Silurian carbonate
“shore” and shelf deposits (after Johnson, 1987).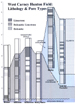 Figure 17. East-west stratigraphic
cross-section of Hunton Group, WCHF, showing lithology and pore types.
Well control is the same as for section in
Figure 17. East-west stratigraphic
cross-section of Hunton Group, WCHF, showing lithology and pore types.
Well control is the same as for section in Figure 19. Plot of core porosity versus
neutron porosity, Hunton Group, WCHF.
Figure 19. Plot of core porosity versus
neutron porosity, Hunton Group, WCHF.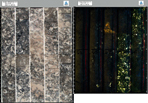 Figure A-1. Marjo Operating Company, Inc.
Williams #1-3, 4962-4972 ft. Facies 7 (coquina)--Lower Cochrane, Big
pentamerid brachiopod coquina. Benthic assemblage BA3—Middle shallow
shelf facies
Figure A-1. Marjo Operating Company, Inc.
Williams #1-3, 4962-4972 ft. Facies 7 (coquina)--Lower Cochrane, Big
pentamerid brachiopod coquina. Benthic assemblage BA3—Middle shallow
shelf facies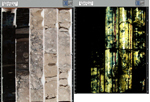 Figure A-2. Marjo Operating Company, Inc.
Wilkerson #1-3, 4950-4964 ft. Facies 7 (coquina)--Good porosity;
Woodford, with clasts of Hunton, above Lower Cochrane, pentamerid
brachiopod coquina.
Figure A-2. Marjo Operating Company, Inc.
Wilkerson #1-3, 4950-4964 ft. Facies 7 (coquina)--Good porosity;
Woodford, with clasts of Hunton, above Lower Cochrane, pentamerid
brachiopod coquina.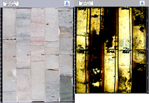 Figure A-3. Marjo Operating Company, Inc.
Boone #1-4, 5057-5067 ft. Facies 4,5,6 (packstone/wackestone)--“Good”
porosity, “moderate” permeability, Lower Cochrane: crinoidal packstone.
Figure A-3. Marjo Operating Company, Inc.
Boone #1-4, 5057-5067 ft. Facies 4,5,6 (packstone/wackestone)--“Good”
porosity, “moderate” permeability, Lower Cochrane: crinoidal packstone.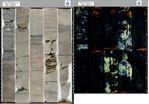 Figure A-4. Marjo Operating Company, Inc.
Carney Townsite #2-5, 4956-4966 ft. Facies 11 (mudstone) above Facies 3
(packstone)--Lower Clarita fine dolomite mudstone (with karst features);
Upper Cochrane fine brachiopod packstone, with porous intervals.
Figure A-4. Marjo Operating Company, Inc.
Carney Townsite #2-5, 4956-4966 ft. Facies 11 (mudstone) above Facies 3
(packstone)--Lower Clarita fine dolomite mudstone (with karst features);
Upper Cochrane fine brachiopod packstone, with porous intervals.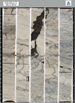 Figure A-5. Marjo Operating Company, Inc.
Houser #1-11, 4961-4971 ft. Karst features: example 1--Solution-enlarged
fracture filled with dark clay sediment (from overlying Woodford).
Figure A-5. Marjo Operating Company, Inc.
Houser #1-11, 4961-4971 ft. Karst features: example 1--Solution-enlarged
fracture filled with dark clay sediment (from overlying Woodford).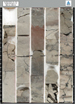 Figure A-6. Marjo Operating Company, Inc.
Houser #1-11, 5041-5951 ft. Karst features: example 2--Terra rosa,
crackle breccia, sediment-filled solution cavities.
Figure A-6. Marjo Operating Company, Inc.
Houser #1-11, 5041-5951 ft. Karst features: example 2--Terra rosa,
crackle breccia, sediment-filled solution cavities.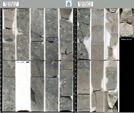
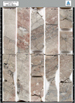 Figure A-8. Marjo Operating Company, Inc. JB #1-13, 5011-5021 ft. Karst
features: example 4--Dipping beds formed by cavern collapse, crackle
breccia, solution-enlarged fracture.
Figure A-8. Marjo Operating Company, Inc. JB #1-13, 5011-5021 ft. Karst
features: example 4--Dipping beds formed by cavern collapse, crackle
breccia, solution-enlarged fracture.