Recognition of Fault Bend Folding, Detachment and Decapitation in Wells, Seismic, and Cores from Norte Monagas, Eastern Venezuela*
By
Chatellier, J-Y.,1 Hernandez, P.,2 Porras C.,2 Olave, S.,2 and Rueda, M.2
Search and Discovery Article #40031 (2001)
1PDVSA Intevep Apdo 76343 Caracas Venezuela
2PDVSA Oriente, Estudios Integrados Pirital, Puerto La Cruz, Venezuela
**Adapted for online presentation from poster session presented at the AAPG Convention, Denver, CO, June, 2001.
Editorial Note: This article, which is highly graphic (or visual) in design, is presented as: (1) six posters, with (a) each represented in JPEG by a small, low-resolution image map of the original; each illustration or section of text on each poster is accessible for viewing at screen scale (higher resolution) by locating the cursor over the part of interest before clicking; and (b) each represented by a PDF image, which contains the usual enlargement capabilities; and (2) searchable HTML text with figure captions linked to corresponding illustrations with descriptions.
Users without high-speed internet access to this article may experience significant delay in downloading some of these illustrations due to their sizes.
First Poster
Second Poster
Third Poster
Fourth Poster
Fifth Poster
Sixth Poster
Our study focused on Santa Barbara Field with integration of our previous studies of the Carito and Furrial fields (Figures 1.1 and 1.3). Various 3D seismic surveys and more than 300 wells on an area of 45 by 12km correspond to the major producing area in Venezuela with in place reserves of 26 MMMbbls and 50 TCF. Our integration was helped by observations and studies from cores, dipmeters, geochemistry, and pressure surveys.
Fault Bend folding (Figure 1.2) recognized on various structural sections has been corroborated by outstanding observations from cores. Regularly spaced flats and ramps of small scale fault bend folds are characterized by slickensides, pressure solution features and quartz cement precipitation.
The use of 3-D statistics enabled us to recognize highly prominent and laterally extensive detachment planes which have been corroborated by our stratigraphers and our reservoir engineers. Abnormal but highly characteristic RFT patterns have been successfully integrated in our study and confirm the small-scale observations made in cores.
One school book example of a large scale decapitation came out of our fault analysis that included generation of fault planes, fault throw maps, birdseye maps and integration with dipmeter and seismic. Thus along the same low angle fault plane, perfectly tied by fifteen wells on an area of 5x5 km, apparent throws gradually change from a repetition of 510 ft to missing sections of more than 3000 ft. Folding occurred before the decapitation phase.
The 3-D seismic confirmed the existence of detachment and decapitation postdating a first folding and thrusting phase.
|
|
Needed Ingredients for Recognition of Fault Bend Folding In order to recognize fault bend folding, the following are needed:
A 2-D projection of all of the tops of the Naricual Superior Santa Barbara field (Figure 2.1) shows anomalous alignments that have been outlined with different colors. The red alignment is centered around a depth of 14850 ft TVDss. Understanding the 2-D projection of Figure 2.2 is not straight forward. The anomaly is better understood on histogram as seen on Figure 2.4. However, that anomaly is just the tip of the iceberg. Figure 2.3 shows a 2-D projection of a group of wells that best express the geometry of the stratigraphic anomaly. Figures 2.5, 2.6, and 2.7 are examples of various types of evidence of detachments. Detachment planes are linked to vertical compartmentalization and local destruction of the reservoir quality below the major fault plane. This is expressed by series of anomalous RFT data points that are aligned against the normal RFT versus depth trend (Figure 2.5). These have been recognized in various part of the field where sandstone units have been transported over other sandstone units. Drag folding is also commonly associated with detachments planes and is readily visible on inverted stacked Bischke plots (Figure 2.6). The two main detachment planes recognized in Santa Barbara seem to be also present in Carito and Furrial (Figure 2.7); that means that the lateral extent of these structural features is of the order of tens of kilometers.
Figure 3.1 illustrates a fault bend fold, a combination of fault and fold. Associated with this feature are repeated sections due to inversion (Figure 3.2) and abnormally thick sections due to folding and associated low-angle faults (Figure 3.3). In Figure 3.3, thickness increase may be due to folding, but also thickness increase may be due to repetition linked to a detachment at 15900 ft TVDss. The cores show some 40 meters of intense fracturing around the detachment plane at 15900 ft TVDss. Note the high density of low angle and horizontal open fractures.
Massive Deformation Bands Associated with Single Detachment Planes
All well locations and depths in Figure 4.1 correspond to official-faults, previously interpreted as individual faults. Our 3-D analysis indicates that these fault cut-outs are on a few low angle planes (Figure 4.2). Systematic features of the reservoir interval are oil-bearing porous sands with very sharp boundaries, quartz cemented tight sands, and slickensided lower boundary. The cored well (Figure 4.3) shows diagenetically altered sandstone with regular spacing. Each of the selected photos shows the systematic existence of a slickensided surface below a tight sandstone with prominent quartz cement. Dissolution features are common, including stylolites and horsetail stylolites.
All of the wells in the area of interest in Santa Barbara field (Figure 5.1) have encountered faults at depths very similar when considering that the overall reservoir thickness is of the order of 3000 feet (Figure 5.3). These fault intersections have been previously interpreted as reverse faults (up to 510 feet of repetition) and as normal faults (as much as more than 2000 feet missing). Some detachment planes are well defined on the seismic (Figure 5.2), where a readily recognizable herring-bone pattern indicates that the displacement along the detachment fault is of large magnitude. Shown by dotted lines in Figure 5.2 is the possible ramp associated with the recognized detachment plane. The fault throw map (Figure 5.4) shows trends that give support to the existence of a single major fault along which both missing and repeated sections are found. The seismic quality and more particularly the seismic migration are very poor; thus only vertical and horizontal faults have proved to be reliably interpreted. Time slices, or depth slices (e.g., Figure 5.6), were used extensively to choose between various hypotheses. A birdseye map (Figure 5.5) was generated using seismic, dipmeter data, and the stratigraphy of the layers recognized below the hypothetical fault plane. The short distance and complexity between chaotic stratigraphic units above the proposed fault plane are in line with the hypothesis of out-of-sequence deformation. This is particularly well developed in the wells with the very large missing section, such as in well 7 (Figure 5.7). Following a compressive phase from the northeast associated with a low angle thrust and its related folding, another compression has led to a partial decapitation of the existing fold (Figures 5.7 and 5.8). The low angle to horizontal detachment planes have been associated with some 400 feet of highly reduced reservoir quality below the 14850 ft detachment plane wherever sand is present above the plane. Where Carapita shales overlie the detachment plane, there is little damage to the underlying reservoir. Other Vital Pieces of Information
Seismic has been of limited help for the interpretation of the Santa Barbara Field. This is due to a combination of factors, including acquisition, processing, and structural complexity (Figure 6.1). All of the production data had to be used to give a reliable model. Visualization has been essential to get the maximum integration with the petrophysicists, geochemists, and especially the reservoir engineer. It has been necessary to make maximum use of 3-D visualization throughout the various phases of interpretation/integration and to make frequent comparisons with outcrop analogues. Geochemistry, petrophysics, and reservoir engineering have been of great help in the structural interpretation. The diagram in Figure 6.2 shows the variability of oil gravity with respect to depth. The API data fully support the Fault Bend Fold model (Figures 1.2, 1.3, 3.1, 5.7, and 6.3) and indicate that oil was emplaced before its full development (FBF). Recognition of fault bend fold, detachment, and decapitation has been possible despite the poor quality of the seismic. That was successful because of:
Parnaud, F., Y. Gou, J. -C. Pacual, I. Truskowski, O. Gallango, H. Passalacqua, and F. Roure, 1995, Petroleum Geology of the Central Part of the Eastern Venezuelan Basin, in Petroleum Basins of South America: AAPG Memoir 62, p. 741 – 756. Thanks to PDVSA Oriente and PDVSA Intevep for the permission to present this paper. |
 Figure
1.1. Tectonic-index map of Eastern Venezuelan Basin, showing location of Furrial
field in Monagas Province (after Parnaud et al., 1995).
Figure
1.1. Tectonic-index map of Eastern Venezuelan Basin, showing location of Furrial
field in Monagas Province (after Parnaud et al., 1995). Figure
1.2. Fault Bend Fold on seismic and in wells in Santa Barbara field.
Figure
1.2. Fault Bend Fold on seismic and in wells in Santa Barbara field.
 Figure
2.2. 2-D projection of all Naricual Superior tops.
Figure
2.2. 2-D projection of all Naricual Superior tops. Figure
2.3. 2-D projection of tops of the Naricual Superior.
Figure
2.3. 2-D projection of tops of the Naricual Superior. Figure
2.4. Frequency of occurrence of top Naricual Superior at a defined depth from a
narrow geographic window.
Figure
2.4. Frequency of occurrence of top Naricual Superior at a defined depth from a
narrow geographic window. Figure
3.1. a. Fault bend fold as seen in cross-section. b. Bischke plot: frontal dip
panel of a fault bend fold.
Figure
3.1. a. Fault bend fold as seen in cross-section. b. Bischke plot: frontal dip
panel of a fault bend fold. Figure
3.2. Inverted series in a fault propagation breakthrough.
Figure
3.2. Inverted series in a fault propagation breakthrough. Figure
3.3. Abnormal thicknesses due to folding and to associated low angle faults.
Figure
3.3. Abnormal thicknesses due to folding and to associated low angle faults.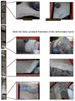 Figure 4.3. Core showing
deformation bands, each of fairly constant thickness. Features include ramps and
flats, along with slickensides and stylolites parallel to bedding; also present
is step ladder pattern showing a succession of flats and ramps.
Figure 4.3. Core showing
deformation bands, each of fairly constant thickness. Features include ramps and
flats, along with slickensides and stylolites parallel to bedding; also present
is step ladder pattern showing a succession of flats and ramps.  Figure
5.1. Structure map on top Naricual, Santa Barbara field, showing study area and
line of seismic section
Figure
5.1. Structure map on top Naricual, Santa Barbara field, showing study area and
line of seismic section Figure
5.2. North-south seismic line, Santa Barbara field
Figure
5.2. North-south seismic line, Santa Barbara field Figure
5.5. Birdseye map of the footwall pertaining to the big detachment fault
Figure
5.5. Birdseye map of the footwall pertaining to the big detachment fault  Figure
5.6. Depth slice showing the vertical transfer faults.
Figure
5.6. Depth slice showing the vertical transfer faults. Figure
6.1. Seismic resolution at 12000 ft in Norte Monagas, in comparison to outcrop
model.
Figure
6.1. Seismic resolution at 12000 ft in Norte Monagas, in comparison to outcrop
model. Figure
6.2. API Gravity versus depth.
Figure
6.2. API Gravity versus depth.