![]() Click to view article in PDF format.
Click to view article in PDF format.
GCEffective Ways to Eliminate Side-Lobe Effects*
Rongfeng Zhang1
Search and Discovery Article #41273 (2014)
Posted February 17, 2014
*Adapted from the Geophysical Corner column, prepared by the author, in AAPG Explorer, February, 2014.
Editor of Geophysical Corner is Satinder Chopra ([email protected]). Managing Editor of AAPG Explorer is Vern Stefanic.
1Geomodeling Technology Corp., Calgary, Alberta ([email protected])
It is no secret that geologists do not fully trust all the events shown in pretty seismic pictures. Even deeper concerns may arise when the images are composed from algorithmic manipulation and transformation of seismic signals, such as seismic attributes – especially spectral decomposition.
In my prior article I reviewed how spectral decomposition is used in seismic interpretation, and pointed out that even though this technique has become a popular interpretation tool in the industry, it does have some issues – including a significant problem called the side-lobe effect. In spectral decomposition, when there is one event (the main lobe) that corresponds to a particular geological feature – like the top or bottom of a formation – there often are several relatively smaller adjacent events, called side-lobes. These are closely related to the main lobe, but have nothing to do with sub-surface geology. For example, many of the strong events shown in warm colors in Figure 1 are self-related and do not correspond to actual geology. The risk of interpreting spectral decomposition results with strong side-lobe effects without good well control is obvious and sometimes very large.
|
|
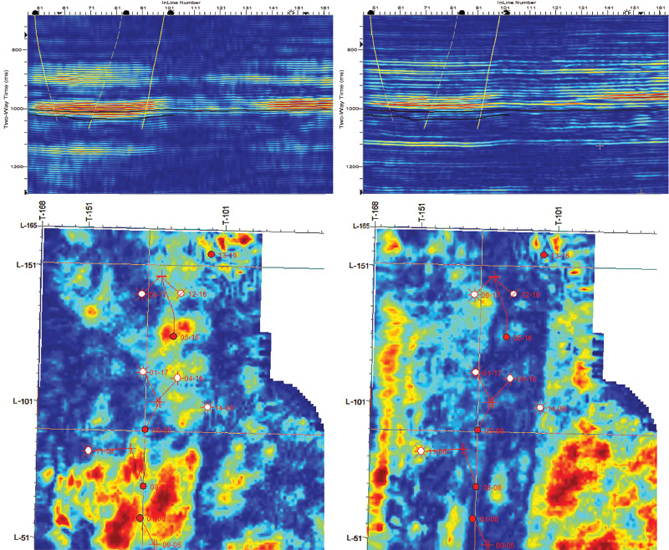
The side-lobe effect in spectral decomposition results from the use of a mathematical function with closed form expressions – such as a mathematical wavelet, a sine/cosine and a Gaussian function, for example – as the basic elements in the algorithm used to compute results. These basic elements are squeezed and stretched analytically and then convolved with the seismic trace to calculate spectral decomposition at different frequencies. Unfortunately, these mathematical expression-based elements rarely resemble the actual seismic data. The Morlet wavelet – the basic element used in continuous wavelet transform (CWT) spectral decomposition – probably is the closest among many other functions to resemble a real seismic wavelet, but is still far from matching real data. Here, we have proposed a new spectral decomposition method that is similar to CWT; however, instead of using a wavelet derived from a mathematical expression, an actual wavelet extracted from the seismic data is used (an example is shown on the top right of Figure 1). Since the real wavelet does not have a simple mathematical expression, we may not be able to transform back from the spectral decomposition. This, however, is regarded as a limited deficiency, since inversion to the original data may not be required in many or most cases. The direct benefit, comparing to CWT and other methods, is that there are fewer side-lobe effects and therefore less ambiguity. The proposed method uses an algorithm similar to CWT, wherein the seismic data is convolved with groups of dilated, squeezed and stretched seismic wavelets. If the closed form expression of a wavelet is known, squeezing and stretching can be easily done – but doing this with a discrete seismic wavelet is challenging and special care is required. Figure 2 shows the spectral decomposition results calculated by CWT and the new method at the same frequency (72 Hz) on a cross line in Blackfoot (Canada) P-wave seismic data. From shallow to deep, there are roughly three groups of events (corresponding to warm colours) where the reservoir is located in the middle group. Comparing the results in Figure 2, it is clear that the new method displays a clear advantage over the CWT method. Fewer side-lobe effects are observed, especially in the first and the third event groups, where some individual events hardly can be distinguished in the results from CWT. In the map view, the results (right) from the new method show the north-south incised valley more clearly. There are the upper channel and the lower channel located in the valley, and they are partially sand-filled and partially shale-filled. Due to this, the sand and shale deposits within the channels in this data set cannot be fully distinguished solely by spectral decomposition results. Some wells penetrate the channels; some do not and are the regional wells as reference. The CWT method shows high amplitudes within the channel, which could be misleading. Spectral decomposition is a powerful interpretation tool, and each method has its advantages and disadvantages. The new method introduced here tries to reduce the side-lobe effects that come with the other methods. The severity of these effects varies across geologic regimes, data sets and frequencies. This new method provides a very attractive option when spectral decomposition side-lobe effects appear to be masking key geologic features. I would like to thank John Sherman for his help in this article. I also would like to thank Geomodeling Technology Corp. for its support. |
 General statement