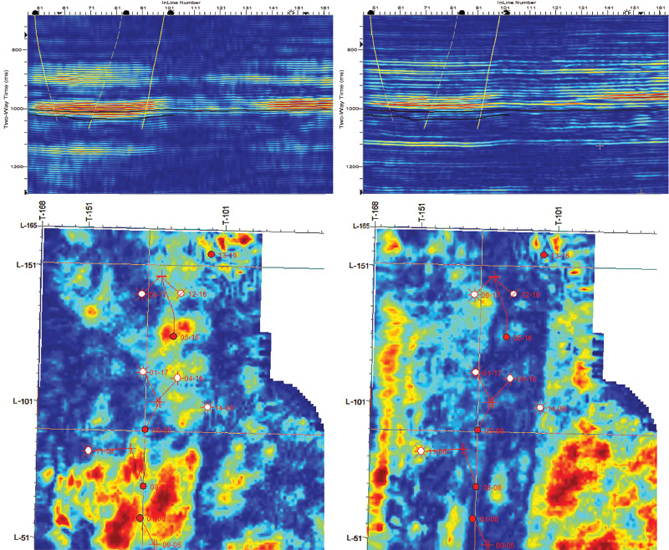
Figure 2. Spectral decomposition results (72 Hz) comparison, with profile view at top row and map view at bottom row (the horizon slices around 0.98 seconds along the middle group of the profile).
Figure 2. Spectral decomposition results (72 Hz) comparison, with profile view at top row and map view at bottom row (the horizon slices around 0.98 seconds along the middle group of the profile).