![]() Click to view article in PDF format
Click to view article in PDF format
Haynesville Play Development: Sustainability Analysis of Local Fresh Groundwater Resources in Northwest Louisiana*
Thomas P. Van Biersel1, Douglas A. Carlson1, and L. Riley Milner1
Search and Discovery Article #80121 (2010)
Posted November 30, 2010
*Adapted from poster presentation at AAPG Convention, New Orleans, Louisiana, April 11-14, 2010
1Louisiana Geological Survey, Louisiana State University, Baton Rouge, LA ([email protected])
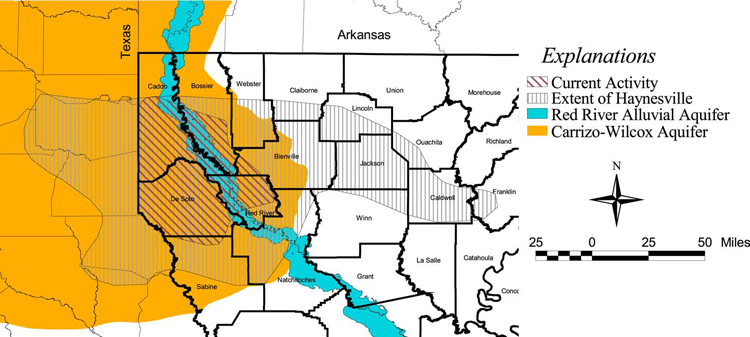
The rapid development of Haynesville Shale (Figure 1), an unconventional gas play, and its reliance on local groundwater resources, has resulted in friction between public and industrial interests. The play is located in a fast-growing area of northwest Louisiana, where no pre-existing water resource management plans exist, and limited potable water resources are available. The proposed approach for the Haynesville of northwestern Louisiana is to drill the production well, and subsequently open the formation to enhance natural gas flow, using hydraulic fracture stimulation (HFS). It has been estimated that the fracture stimulation process for each well drilled in the Haynesville will require several million gallons of water per well. Regionally, fresh water is available from several reservoirs and the Red River; however, with the exception of shallow groundwater resources, there are no readily-available ample sources of water in a large portion of the area.
There are two heavily-used aquifers in the subject area identified for early development: the Carrizo-Wilcox (CWA) and Red River Alluvial (RRAA) aquifers. Based upon a review of existing data, and a capture zone analysis, the CWA has a large regional storage, but locally poor productivity as an aquifer. It is also subject to locally-elevated drawdown values, and the creation of large capture zones. In comparison, the RRAA is a much more prolific aquifer, although at times it appears to be used at a level above its sustainable yield. A more thorough analysis and model of these water resources is needed to better estimate and manage the aquifers, and to provide for domestic, public and industrial needs.
|
The use of groundwater for drilling and HFS has, in some cases, caused issues with local water well owners situated over the Haynesville Play in northwest Louisiana. These problems lead the LA Dept. of Natural Resources’ (LDNR) Commissioner of Conservation to issue a Ground Water Use Advisory on 10/16/2008, recommending “wise water use planning in the Haynesville Shale.” However, little or no action has been taken to prepare a water management plan. The groundwater issues stem from the heterogeneity and anisotropy and aerially discontinuous thin freshwater sands of the locally-used CWA (Figure 1), and the presence of salty groundwater at shallow depths (Figure 2). In addition, federal and state regulations protecting wetlands and fishing stocks preclude the use of certain surface water bodies. Furthermore, these areas of Texas and Louisiana are prone to extended drought periods that exacerbate the situation. Based upon recent Chesapeake Energy (Chesapeake) data, the standard well uses ~100,000 barrels (bbls) for drilling and initial HFS (Chesapeake Energy 2010a and 2010b; and Satterfield, 2008). Using a 15% recovery and 85% reuse number, the reuse available for a second HFS would amount to ~9,500 bbls, resulting in the need for another ~65,500 bbls of freshwater (Figure 2). Based on the LDNR SONRIS database, one well was completed in the Haynesville in 2007. In 2008, there were another 35 wells. As of 10/30/09 another 671 wells were drilled or were in the process of being completed. Assuming that each of those wells used 25,000 bbls of freshwater for drilling, and another 75,000 bbls of freshwater for fracturing (Satterfield, 2008), that would suggest that in 2007 ~0.1 million bbls (mbbls) of water was used, another ~3.5 mbbls in 2008, and at least another ~67.2 mbbls in 2009. The cumulative total (~70.7 mbbls) represents a volume of freshwater equal to 9,100 acre-foot of fresh (potable) water. Based upon rig count predictions, (Briggs, 2009; and Scott, 2009), it can be estimated that for the near future the yearly freshwater supply needed by the operators will remain relatively stable, unless the price of natural gas increases above its current level. However, Chesapeake indicated on their website that in 2009 they would drill ~125 wells. They also anticipate drilling ~175 wells in 2010 (a 40% increase). As of 2/4/2010 the LDNR reported 946 well in some degree of completion in the Hayesville.
The CWA was deposited in a deltaic environment. It is composed of interbedded discontinuous freshwater sands and clay layers. These sand layers are thin (<10 ft thick) to moderately-thick (up to 110 ft). On average, the sands range in thickness from 43 to 62 ft, with the thicker units occurring toward the base of the unit. Although these poorly-sorted sands can be sufficiently thick, the grain size of the deposits is fine sand. However, a general coarsening with depth is observed in logs. Most of the unit has a relatively low hydraulic conductivity (K). The K values range from ~0.3 ft/day [0.1 Darcy (D)] (oil/gas permeameter tests) to 12.5 ft/day (4.6 D - Page and May, 1964). This large range in K values is indicative of CWA’s heterogeneity and anisotropy. For the purpose of calculations in this study, an average K value of 8.9 ft/day (3.3 D) was used. Based upon this, and water well reports filed with the LA Dept. of Transportation and Development (LDOTD), the CWA sands yield ~0.5 gpm per foot of drawdown. The regional direction of groundwater flow is from the highlands toward the Red River.
The sands of the CWA are predominantly confined and under artesian condition. The recharge area of the aquifer lies between the Sabine and the Red rivers. Although the outcrop of the aquifer extends farther west than the Sabine River, in this study it is assumed that the Sabine intercepts all the water flowing through the relatively thin aquifer west of the River and does not recharge the aquifer. Based upon published information by the U.S. Geological Survey (Sargent, 2007), the current water demand on the CWA is ~11.92 mgd. This demand comes mainly from domestic (26%) and public water supplies (43%), representing between 5.6 and 2.2% of the water recharging the aquifer, and 0.03% of the water stored in the aquifer.
Within the study, the cumulative sands (using sands >20 ft thick) of the CWA are ~112 ft thick. Based upon this thickness, capture zone analyses were performed, using a regional gradient of 0.001 (from a topographic high in western Caddo Parish to the Red River). Using an hydraulic conductivity of 8.9 ft/day, a water budget can be formulated (Figure 3). The steady state maximum width of a well’s capture zone [Ymax (Fetter, 2001)] was calculated, using an equation derived from Todd (1980) and Grubb (1993). Based upon this data, a maximum capture zone (e.g. cone of depression) and drawdown can be estimated (Figure 4). For example, for a standard domestic well completed in one sand (~56 ft thick), with a capacity of 10 gpm, if the well was run continuously, it would cause 18.8 ft of drawdown at the well and create a capture zone with a radius of 860 ft. In other words, it would impact 53 acres. It should also be noted that most of the drawdown would occur near the well, and that well efficiency was not taken into consideration. Also, the saltwater occurs at relatively shallow depths in the study area (Figure 5).
The Red River Alluvial Aquifer
The RRAA is a 4 to 9-mile wide valley-fill aquifer (Figure 1). It is comprised of one alluvial sand, which coarsens with depth, and in most cases includes a basal sand and gravel deposit (Newcome, 1960). The sand and gravel deposit at the base ranges in thickness from 0 to 36 ft. The RRAA is mainly confined above by a clay, and below by the clays (and sands) of the CWA. It is approximately 50 ft thick, and ranges from 0 to 120 ft in thickness. It is under artesian condition, and therefore, is not recharged through the overlying clay. Locally, the Red River is in hydraulic communication with the aquifer (Newcome, 1960; and Rapp, 1996). The river is a discharge point for the aquifer; however, (based upon historical data) during ~ 20% of the year the flow direction between the river and the RRAA is reversed. This results in river water recharging the aquifer.
The RRAA has an elevated K, ranging between 27.2 ft/day (10 D - specific capacity tests from LDOTD) and 216 ft/day or 1600 gpd/ft2 (79 D – Page and May, 1964), and a relatively high average porosity (~26%). These values, as well as the calculated water content of the aquifer of 1,083 mgal, can be compared to the estimated water withdrawn from the aquifer yearly at 3.08 mgd. Using an average thickness of 50 ft for the RRAA, a capture zone analysis was performed, using a regional gradient of 0.0006 and a K of 216 ft/day (Newcome, 1960), and a water budget formulated for the aquifer (Figure 3). Based upon the information gathered in this study, a maximum capture zone and drawdown can be estimated (Figure 6). For example, for a standard residence well with a capacity of 10 gpm, if the well was run continuously, it would cause 1.8 ft of drawdown at the well, and create a capture zone with a radius of 154 ft. In other words, it would impact ~2 acres. Based upon these values, it would take a pumping rate greater than 300 gpm to cause the aquifer to become unconfined in the vicinity of the well (locations where the overlying clay and aquifer are each 50 feet thick). However, it should be noted that most of the drawdown would occur near the well, and that well efficiency was not taken into consideration.
A review of existing geohydrologic data and capture zone analyses was completed for the CWA and RRAA of northwest Louisiana. The CWA is a marginally-permeable aquifer, composed of up to five discontinuous sands. The CWA is subject to elevated drawdown and large capture zone, and is of limited use as a large water producer. In comparison, the RRAA is a much more prolific aquifer. However, historical data indicate that at times the RRAA appears to be used at a level above its sustainable yield, resulting in leakage from the river into the aquifer. A more thorough analysis of these resources is needed to better estimate and manage them.
Boniol, D., 1988, Recharge potential of Louisiana aquifers: Louisiana Geological Survey Open-File Series 88-07, 1 plate.
Briggs, D., 2009, The state of oil and gas in Louisiana: Transaction of the Baton Rouge Geological Society’s 1st Annual Louisiana Oil and Gas Symposium, v. 1, p. 7-19.
Carlson, D., T. Van Biersel, and L.R. Milner, 2008, Distribution of chemical agents which are adversely impacting water quality that are related to lignite within aquifers of northwestern Louisiana: Draft report to the Louisiana Dept. of Transportation and Development, 101 p.
Chesapeake Energy, 2010a, Water use in deep shale gas exploration: Chesapeake Energy Fact Sheet, 2 p., http://www.chk.com/Media/ (accessed 8/27/2010).
Chesapeake Energy, 2010b, Water use in Haynesville deep shale gas exploration: Chesapeake Energy Fact Sheet, 2 p., http://www.chk.com/Media/ (accessed 8/27/2010).
Fetter, C., 2001, Applied Hydrogeology (4th ed.): Prentice Hall, Upper Saddle River, New Jersey, 598 p.
Grubb, S., 1993, Analytical model for estimation of steady-state capture zones of pumping wells in confined and unconfined aquifers: Ground Water, v. 31/1, p. 27-32.
Newcome, R.,1960, Ground-water resources of the Red River Valley alluvium in Louisiana: Louisiana geological Survey Water Resources Pamphlet no. 7, 21 p.
Page, L. and H. May, 1964, Water resources of Bossier and Caddo Parishes, Louisiana: Louisiana Geological Survey Water Resources Bulletin, v. 5, 105 p.
Rapp, T., 1996, Ground-water resources of Caddo Parish, Louisiana, 1992: Louisiana Dept. of Transportation and Development Water Resources Technical Report, v. 58, 89 p.
Sargent, P., 2007, Water use in Louisiana, 2005: Louisiana Dept. of Transportation and Development Water Resources Special Report, v. 16, 133 p.
Satterfield, J., 2008, Managing Water Resource’s Challenges in Select Natural Gas Shale Plays: Proceeding of the 25th Ground Water Protection Council Annual Forum, Abstract 46. Web accessed 27 August 2010. http://www.gwpc.org/meetings/forum/2008/proceedings/Ground%20Water%20&%20Energy/SatterfieldWaterEnergy.pdf
Scott, L., 2009, The economic impact of the Haynesville Shale on the Louisiana Economy in 2008: Report prepared by Loren C. Scott & Associates for the Louisiana Department of Natural Resources, p. 25, Web access 27 August 2010. http://dnr.louisiana.gov/haynesvilleshale/loren-scott-impact2008.pdf
Todd, D., 1980, Groundwater Hydrology (2nd ed.): John Wiley and Sons, New York, New York, 535 p.
Van Biersel, T. and D. Carlson, 2009, Distribution of Selected Water Nuisance Chemicals and Brine Tracers in Sparta Aquifer Wells in Louisiana: Transaction of the Baton Rouge Geological Society’s 3rd Annual Louisiana Groundwater Symposium, v. 3, p. 17-22.
Van Biersel, T., L.R. Milner, and E. Walden, 2008, Development of a chloride standard exceedance map for Louisiana: Gulf Coast Association of Geological Societies Transactions, v. 58, p. 875-881.
Copyright © AAPG. Serial rights given by author. For all other rights contact author directly. |


