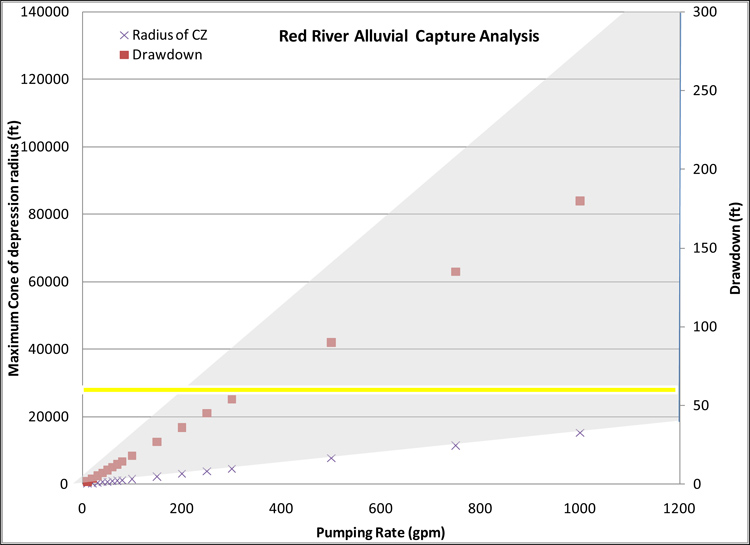
Figure 6. Capture zone analysis for the RRAA depicting the maximum zone of influence and well drawdown per pumping rate. The yellow
line represents the approximate depth at which point the aquifer changes from a confined to an unconfined condition. The shadow represents
the range in K values (27 and 216 ft/day).