 Click to view posters in PDF format (30 mb).
PSDepositional Facies Patterns and Resultant Heterogeneity in Carbonate Sand Reservoirs – Insight from Modern Analogs*
Paul M. (Mitch) Harris1 and James Ellis2
Search and Discovery Article #50324 (2010)
Posted September 30, 2010
*Adapted from poster presentation at AAPG Annual Convention and Exhibition, New Orleans, Louisiana, April 11-14, 2010
1Chevron Energy Technology Company, San Ramon, California ([email protected])
2Ellis GeoSpatial, Walnut Creek, California ([email protected])
Abstract
Processed satellite images, derived bathymetry, and sand body interpretation maps of three key areas of modern carbonate sand deposition on Great Bahama Bank are organized into a GIS to develop morphometric data that can support reservoir characterization and modeling. Collectively these three sand deposits occur along an ~370 km belt paralleling the platform edge and show a range of depositional facies patterns found in grainstone reservoirs.
(1) Rimming the southern end of Tongue of the Ocean (TOTO) is the broadest expanse of “high-energy” sands found in the Bahamas, a tidal bar and channel belt covering 3123 km² with bars extending onto the shallow platform for nearly 20 km. This sand deposit is generally characterized by narrow sand bars separated by wide, deep channels and a lack of islands.
(2) A variation of the tidal bar motif occurs at the northern end of Exuma Sound (Schooners Cays), where a belt covering 716 km² is progressively set back from the platform edge toward the west and, in comparison to TOTO, contains broader and more irregular sand bars up to 15 km long with relatively deep and narrow channels and few small islands.
(3) Sands associated with tidal channels and the numerous islands of the Exumas chain along the western edge of Exuma Sound occur primarily as flood tidal deltas in a 272 km² linear belt set back from the platform edge, with delta lobes extending 5-10 km onto the platform. The islands, often two or three paralleling each other, and the inter-island gaps (= channels) control the distribution of sand.
In each of the three cases, the carbonate sand belt was interpreted by selecting different water depth intervals and different portions, for instance sands in shallow high-energy zones versus those at deeper depths, were highlighted for visual analysis and morphometric measurements. For example, sizes (area, principal axis ratios) and shapes (perimeter, shape factor) of sand bodies are compared at a variety of scales, e.g., the total sand belt, domains within the sand belt identified by common patterns of sand bodies, individual tidal bars or deltas, and shallowest portions of tidal bars or deltas. Profiles and spatial analysis tools enable sand body and channel spacing, position relative to the platform margin, and volumes to be characterized. We think such results add value to the characterization and modeling of carbonate reservoirs and improve our understanding and predictability of reservoir heterogeneity.
Rationale for Study
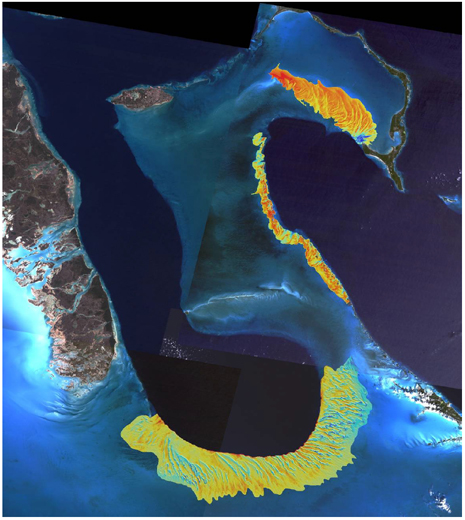 Sand-rich areas, southern end of Tongue of the Ocean and north and west of Exuma Sound.
We use the three key areas of modern carbonate sand deposition highlighted on Great Bahama Bank to develop morphometric data that can support reservoir characterization and modeling and improve our understanding and predictability of reservoir heterogeneity.
Collectively, the three sand deposits occur along an ~370 km belt paralleling the platform edge and show a range of depositional facies patterns found in grainstone reservoirs.
Study Areas on Great Bahama Bank
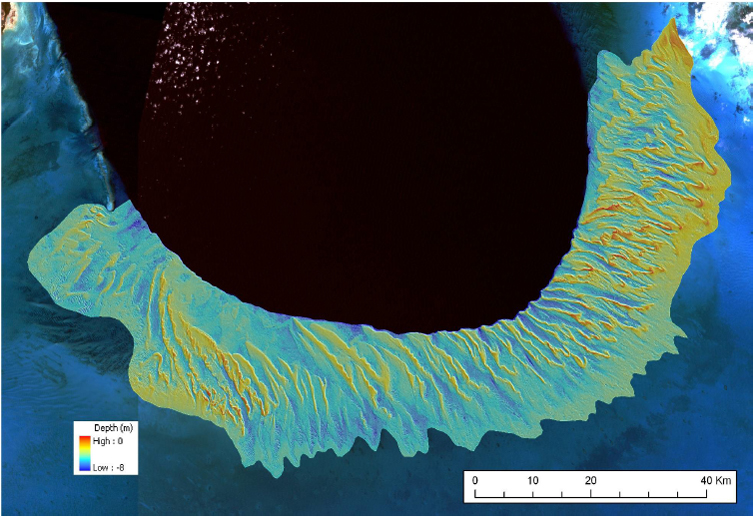 Rimming the southern end of Tongue of the Ocean (TOTO) is the broadest expanse of “high-energy” sands found in the Bahamas.
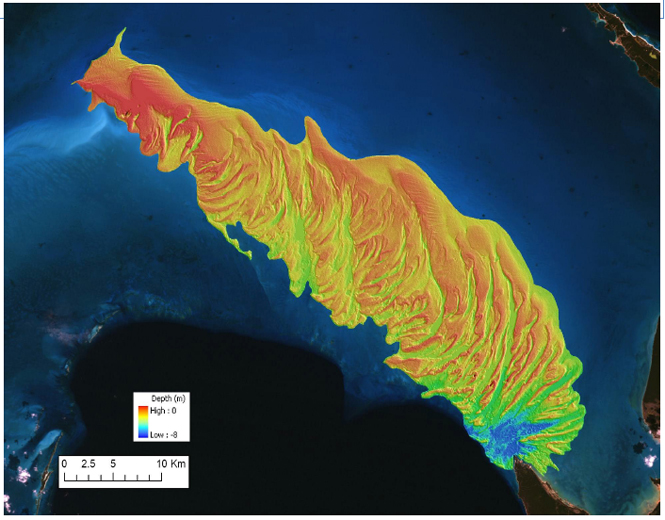 A variation of the tidal bar motif occurs at the northern end of Exuma Sound (Schooner Cays), where a sand body is progressively set back from the platform edge toward the west.
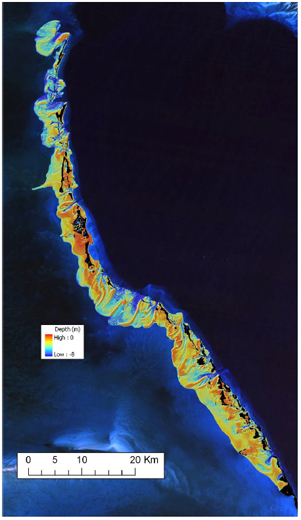 Sands associated with tidal channels and the numerous islands of the Exumas chain along the western edge of Exuma Sound occur primarily as flood tidal deltas.
Rimming the southern end of Tongue of the Ocean (TOTO) is the broadest expanse of “high-energy” sands found in the Bahamas, a tidal bar and channel belt covering 3120 km² with bars extending onto the shallow platform for nearly 20 km. This sand body is generally characterized by narrow sand bars separated by wide, deep channels and a lack of islands.
A variation of the tidal bar motif occurs at the northern end of Exuma Sound (Schooner Cays), where a sand body covering 716 km² is progressively set back from the platform edge toward the west. In comparison to TOTO, it contains broader and more irregular sand bars up to 15 km long with relatively deep and narrow channels and few small islands.
Sands associated with tidal channels and the numerous islands of the Exumas chain along the western edge of Exuma Sound occur primarily as flood tidal deltas in a 446 km² linear belt set back from the platform edge, with delta lobes extending 5-10 km onto the platform. The islands, often two or three paralleling each other, and the inter-island gaps (= channels) control the distribution of sand.
Sand Body Interrogation Strategy
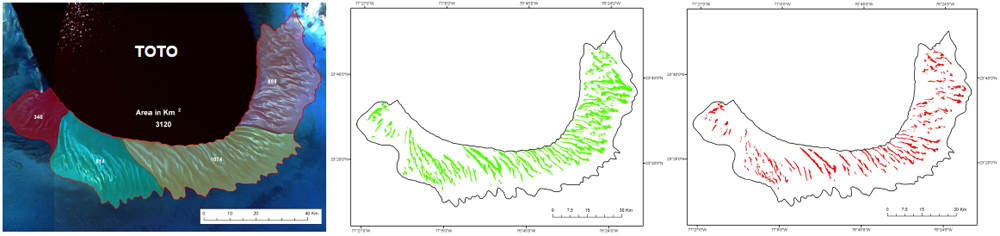 Sand body domains, individual sand bars, and bar crests, TOTO.
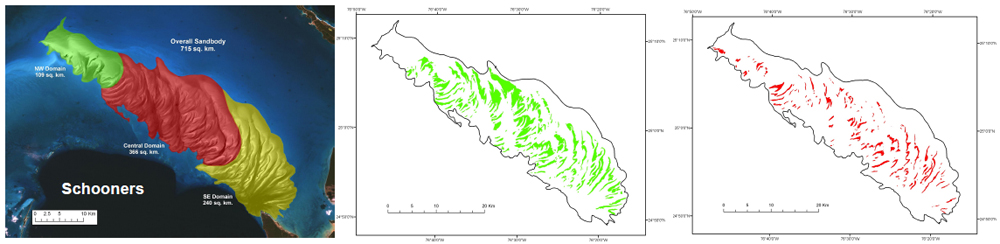 Sand body domains, individual sand bars, and bar crests, Schooners
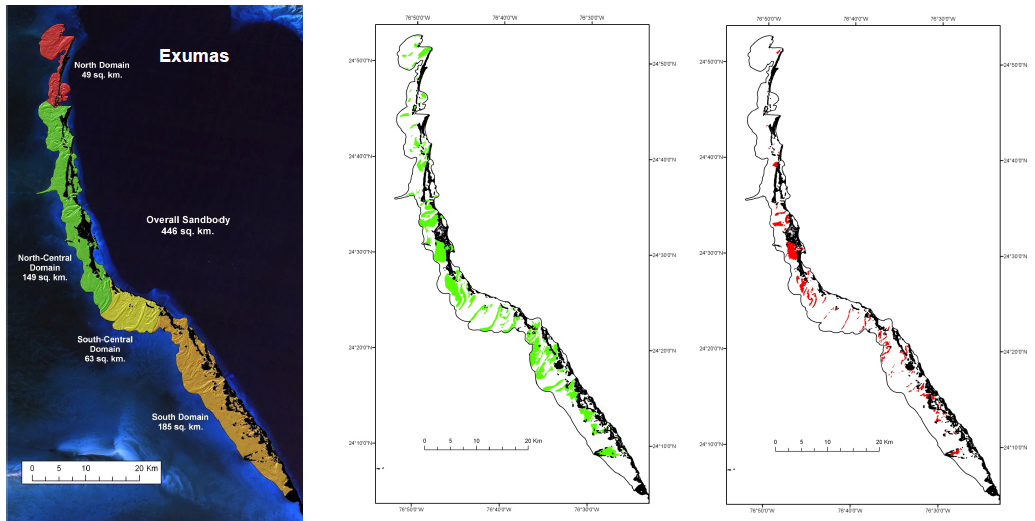 Sand body domains, individual sand bars, and bar crests, Exumas.
Each carbonate sand body is interpreted by selecting different domains and delineating individual sand bars and bar crests, and the different portions are highlighted for visual analysis and measurements (TOTO, Schooners, Exuma).
Delineating the Sand Bars and Bar Crests
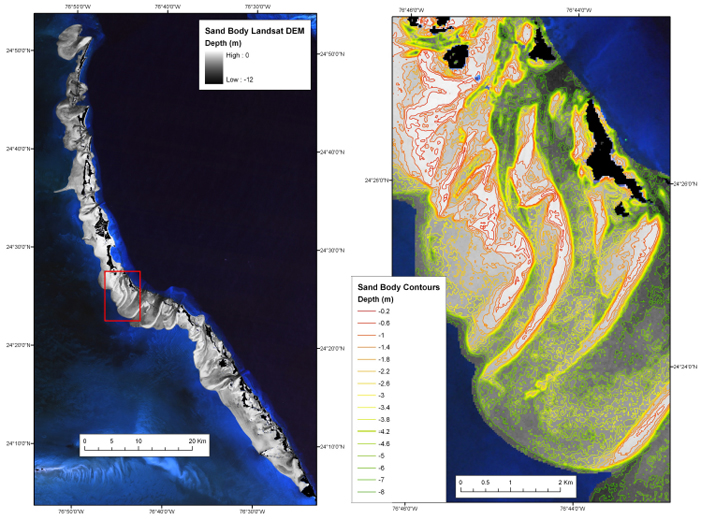 Red outline shows enlarged subarea of Exumas. Contours of the bathymetric DEM are draped over the Landsat color image (enlargement of subarea) (right).
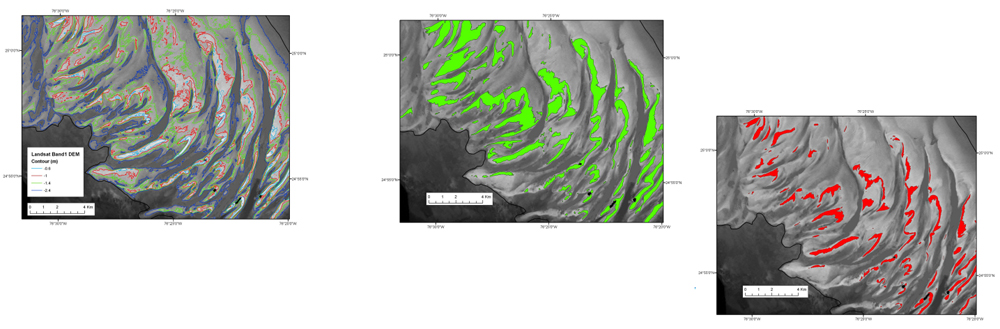 Select contours derived from Schooners bathymetric DEM, delineating individual sand bars (green polygons—center) and their bar crests (red polygons—right).
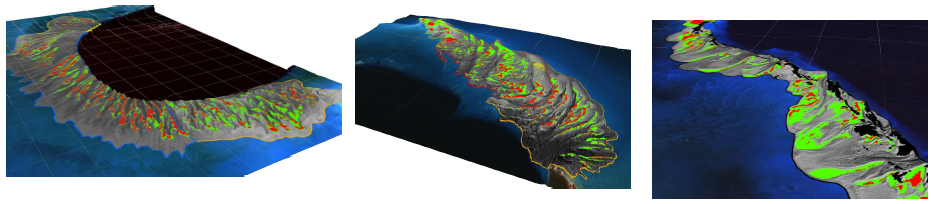 Individual sand bars and bar crests in perspective view (TOTO—left; Schooners—center; Exumas—right).
Exumas
Red outline shows enlarged subarea. Contours of the bathymetric DEM are draped over the Landsat color image (enlargement of subarea).
Schooners
Select contours derived from Schooners bathymetric DEM illustrate methodology used to delineate individual sand bars and their bar crests. Individual sand bars are highlighted with green polygons. Bar crests are indicated by red polygons.
Perspective view
Individual sand bars and bar crests are shown for each sand body in perspective view and draped on the bathymetric DEM. The sand bar polygons are used for deriving spatial statistics within the sand body based on area, shape, and water depth.
Size of the Sand Body, Domains, and Sand Bars
 Table of area of sand bodies (left) and table of area of sand body domains (right).
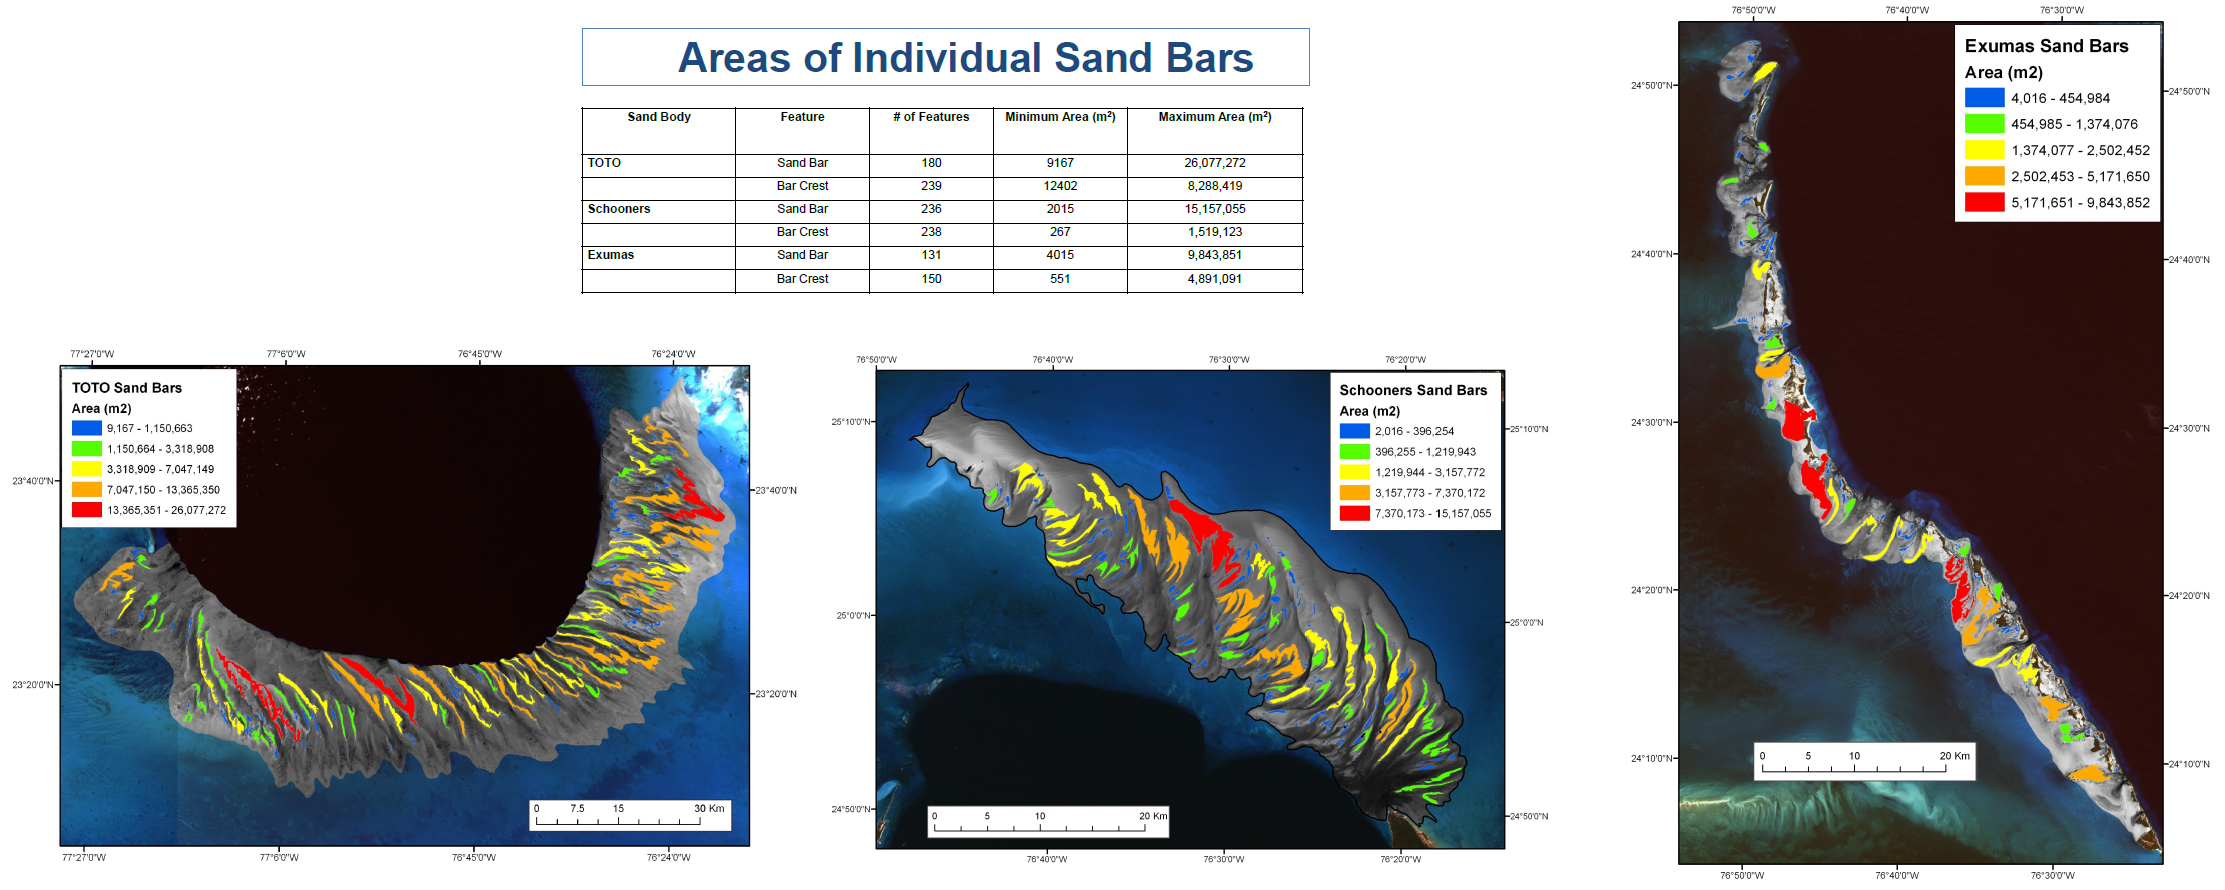 Table and images of areas of individual sand bars, TOTO, Schooners, and Exumas.
Area of sand bodies, area of sand body domains, and areas of individual sand bars are shown in tables; the last is shown as images of TOTO, Schooners, and Exumas.
Bathymetric Profiles
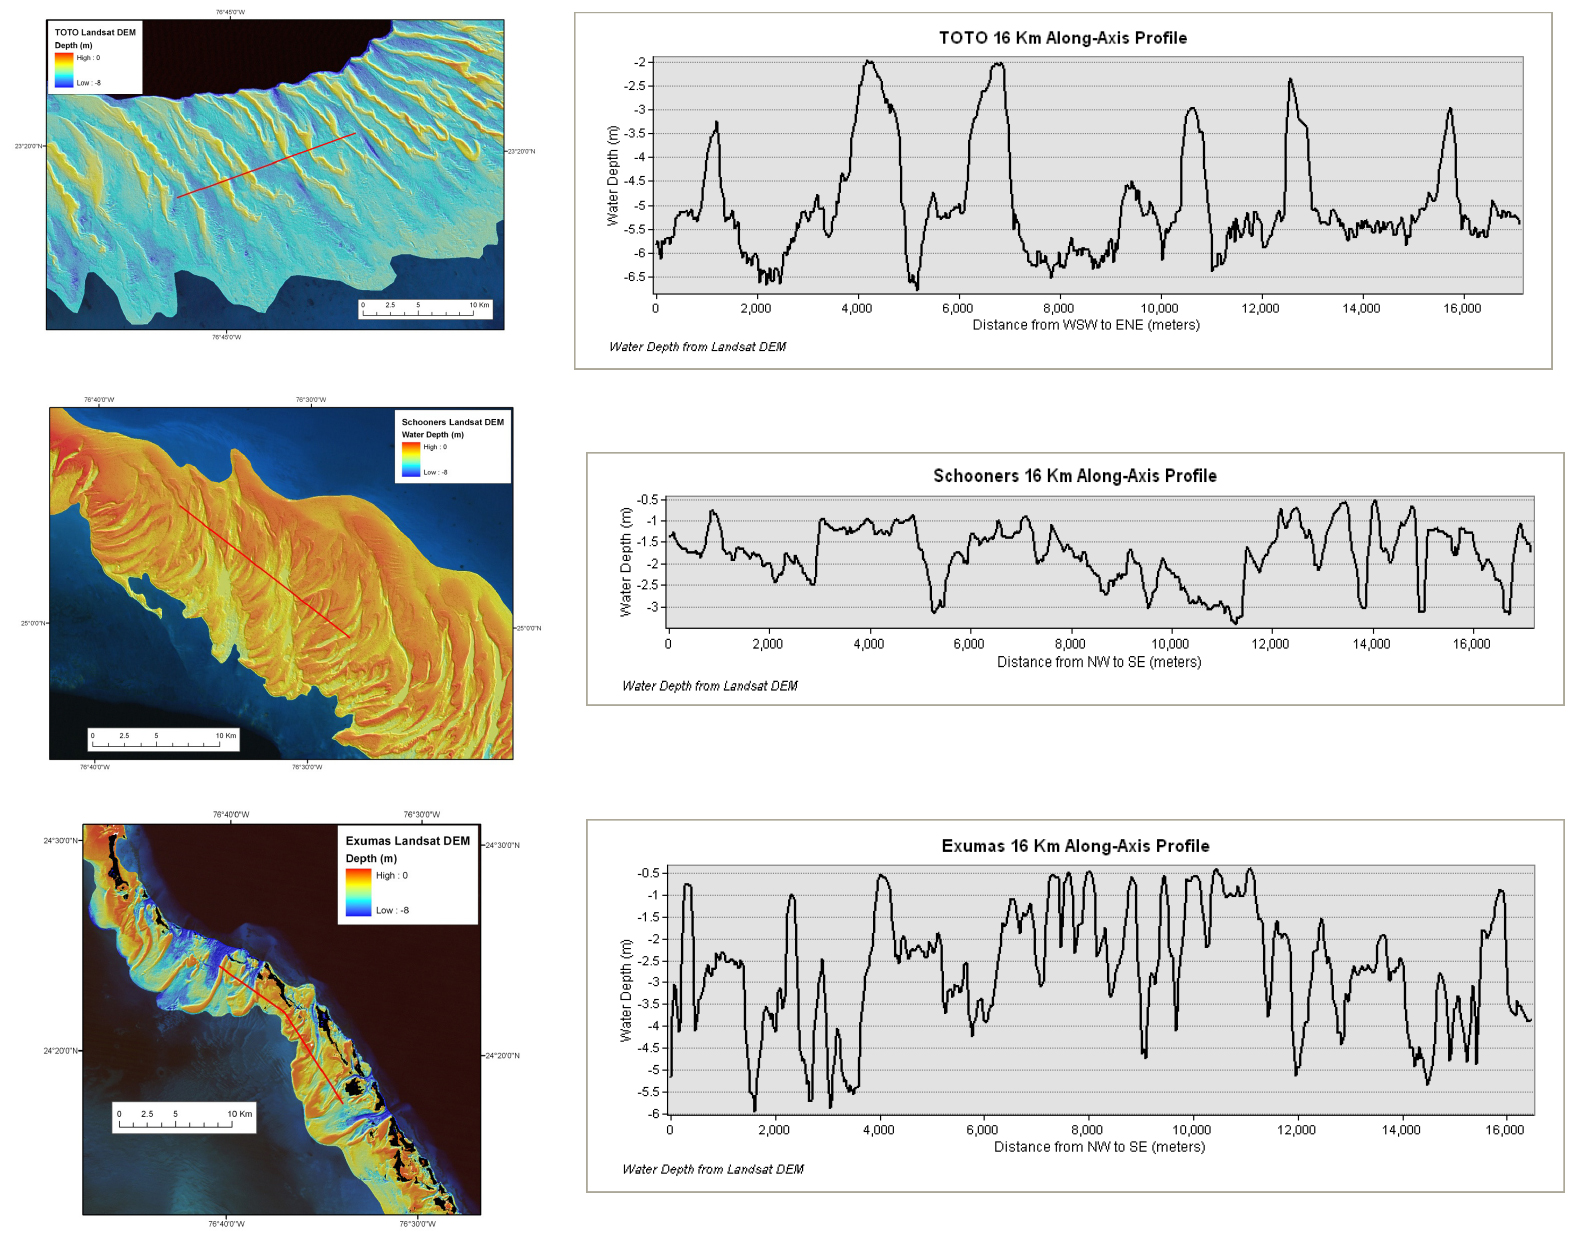 Bathymetric profiles of sand bars at TOTO, Schooners, and Exumas.
Profiles illustrate variable fill of accommodation space = heterogeneity and correlation challenges between wells. Note differences between the three areas in height and width of the sand bars, spacing between bars, and depth of tidal channels.
Sand Bar Centroids
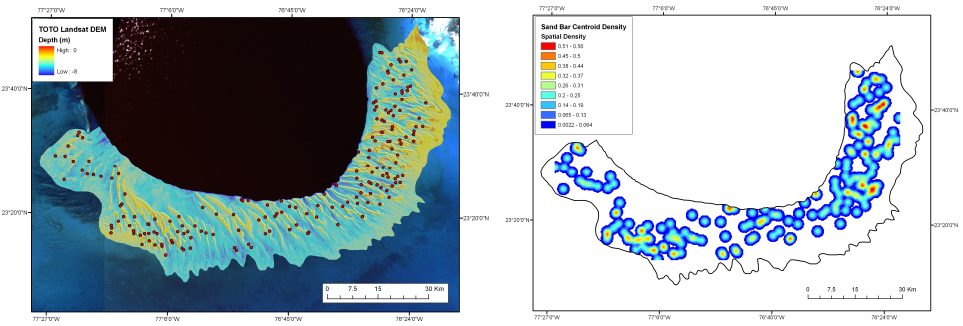 Centroids and centroid density, TOTO.
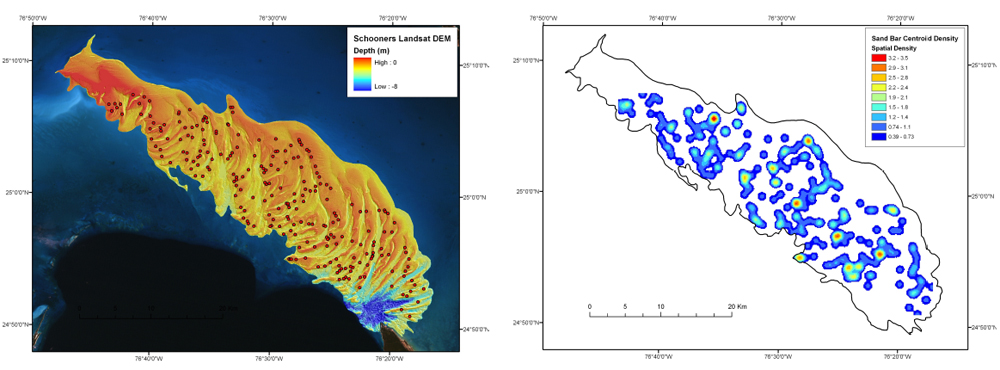 Centroids and centroid density, Schooners.
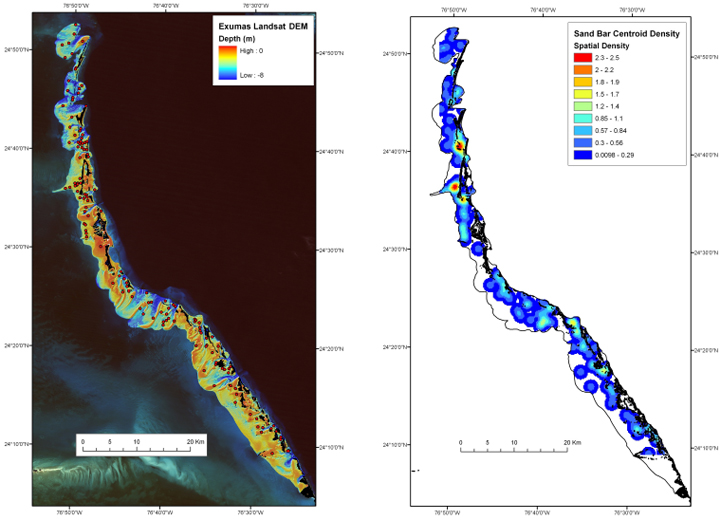 Centroids and centroid density, Exumas.
Centroids represent the spatial “center point” for each individual sand bar. The density of centroids potentially illustrates a “sweet spot” within the sand body. In this case, the density does not reflect the shape or size of each of the three sand bodies (TOTO, Schooners, and Exumas), perhaps due to the methodology used for determining centroid density .
Centerlines of Sand Bars
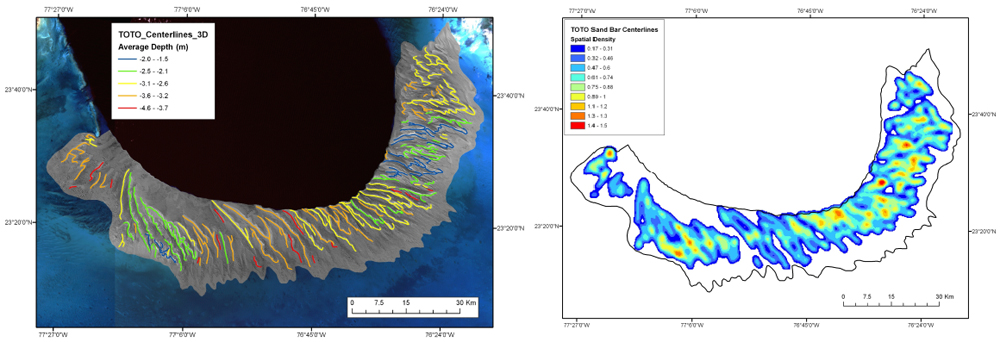 Centerlines along the axes of individual sand bars and their density, TOTO.
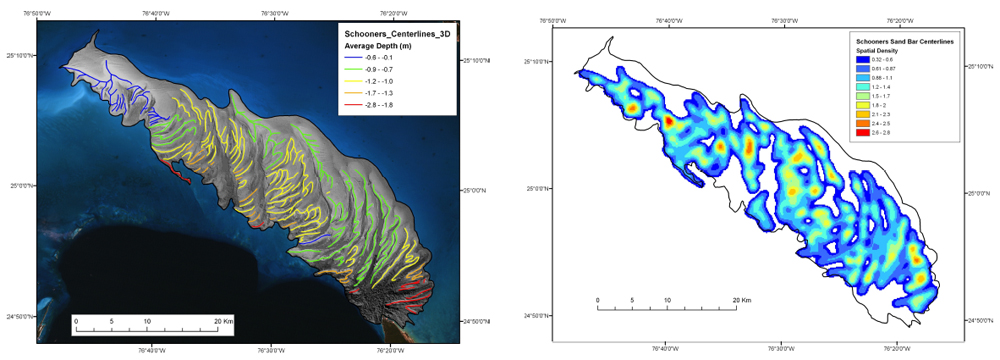 Centerlines along the axes of individual sand bars and their density, Schooners.
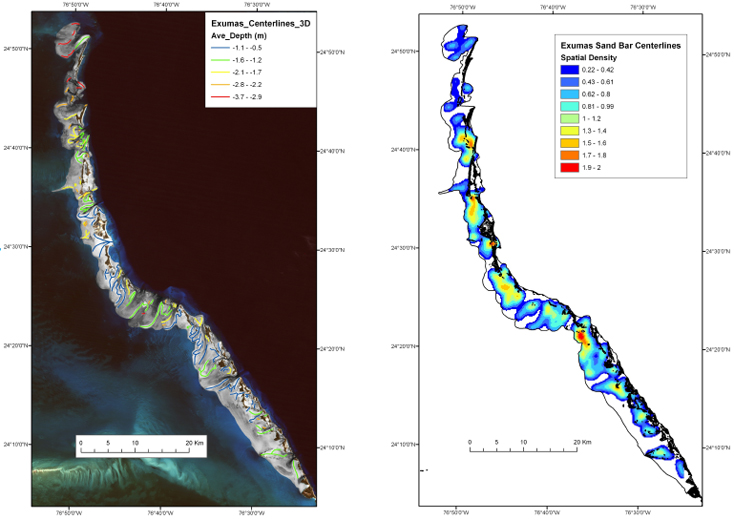 Centerlines along the axes of individual sand bars and their density, Exumas.
Centerlines along the axis of each sand bar provide information that complements their polygon outlines. Here centerlines are also color coded to show water depth. The density of centerlines further illustrates the spacing of “sweet spots” within the sand body. TOTO and Schooners, the two sand bodies without islands, have very similar centerline density (32% and 35%, respectively), whereas the island-rich Exumas has a relatively lower centerline density (21%).
Shape Parameters of Sand Bars
 Shape parameters of sand bars.
 Morphometric data for 547 sand bars.
Shapes are calculated for individual sand bars using a variety of parameters to facilitate a more direct comparison of sand bars within and between the three sand bodies. Morphometric data were collected for 547 sand bars.
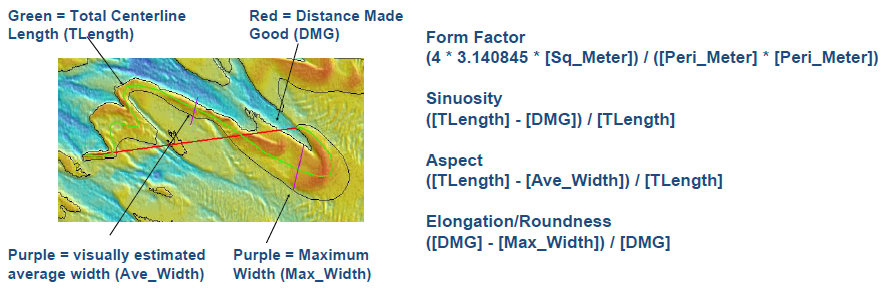
Form Factor
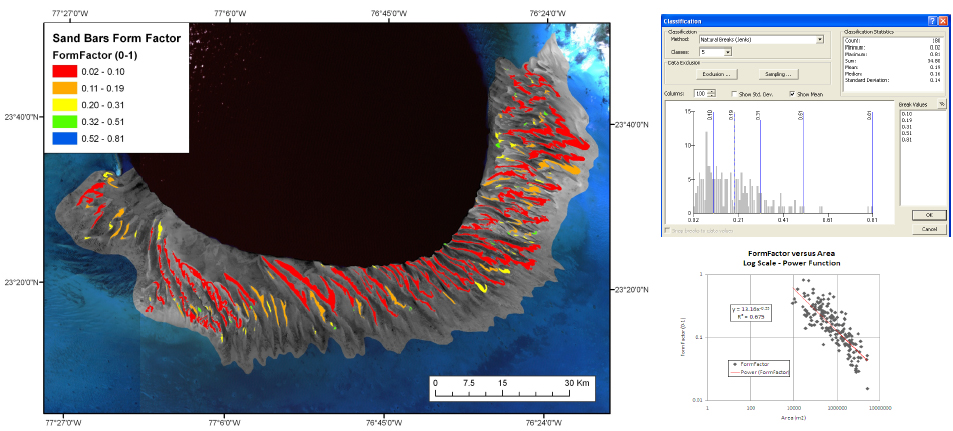 Form Factor for individual sand bars (draped on the DEM, plotted against number and against area), TOTO.
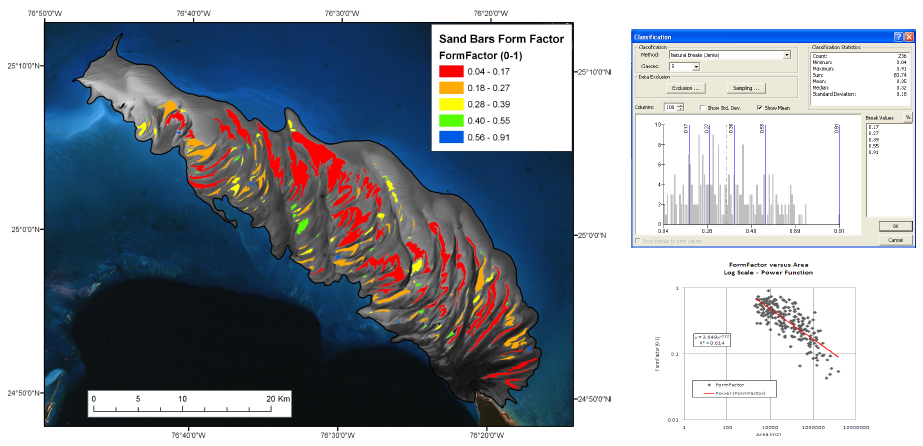 Form Factor for individual sand bars (draped on the DEM, plotted against number and against area), Schooners.
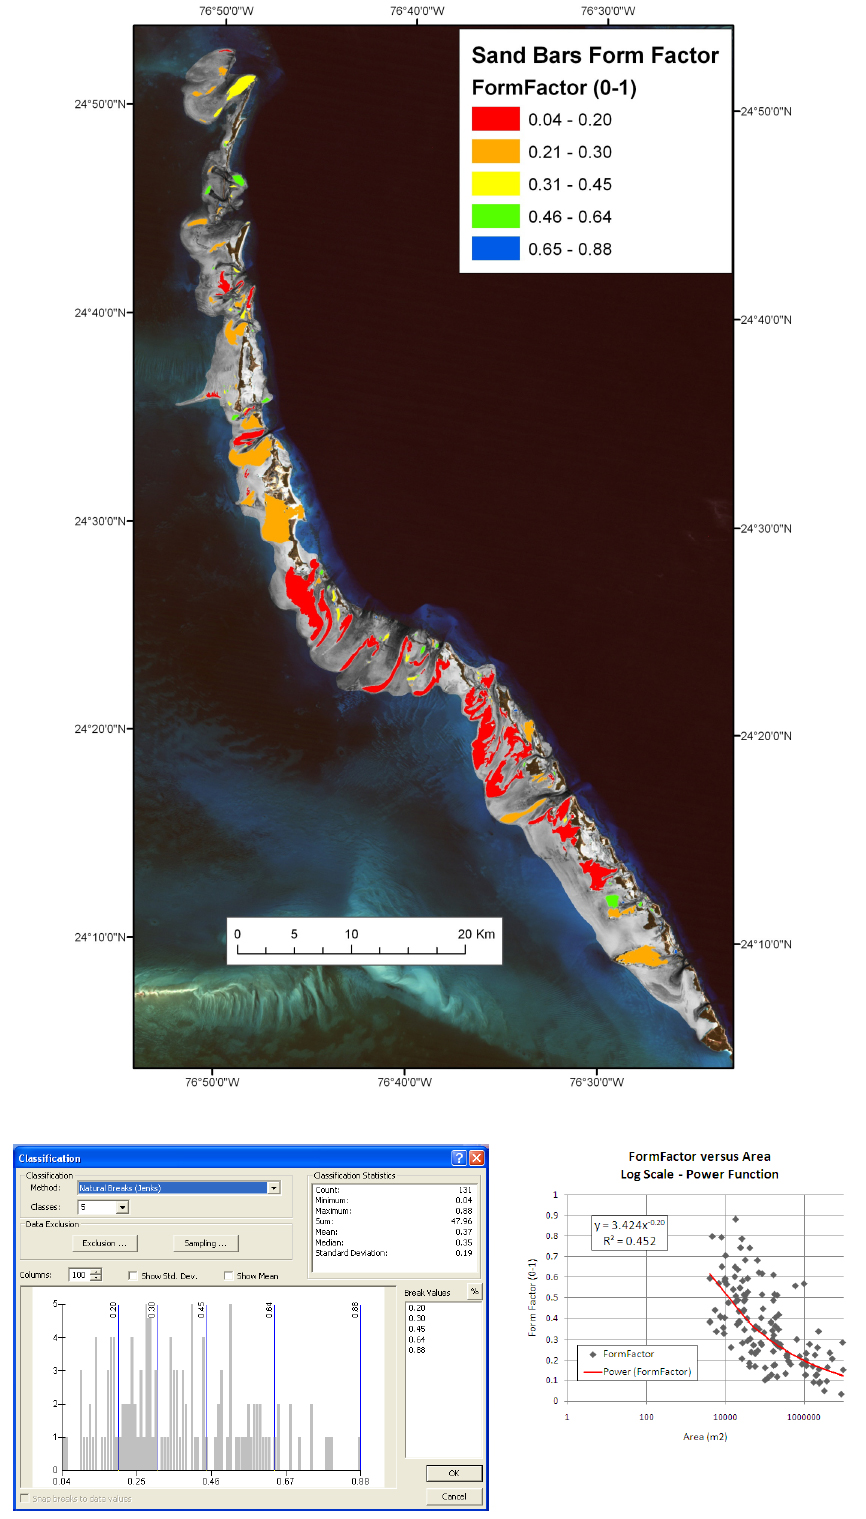 Form Factor for individual sand bars (draped on the DEM, plotted against number and against area), Exumas.
Form Factor for individual sand bars within each sand body is shown spatially by being draped on the DEM (TOTO, Schooners, Exumas). Vertical axis on the chart accompanying each is number of sand bars and horizontal axis is form factor. Form Factor and area for individual sand bars are also compared.
Summary of Shape Parameters for Sand Bars
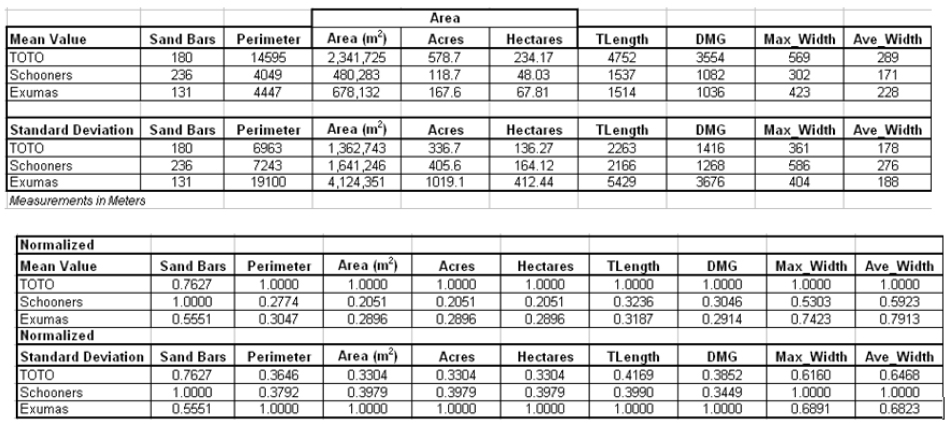 Measurement averages for sand bars (upper) and normalization of size averages for sand bars (lower).
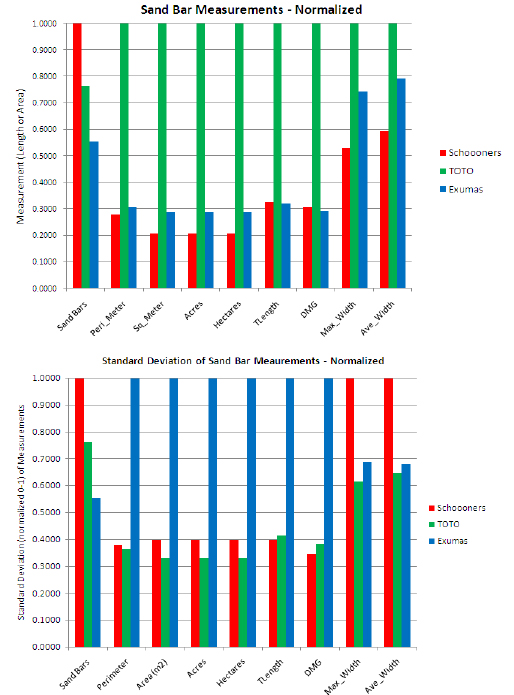 Normalization of size averages for sand bars (upper) and associated standard deviation (lower).
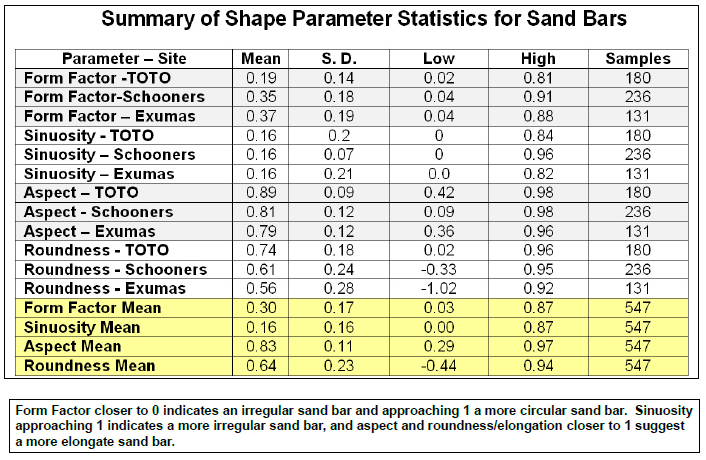 Summary of the parameter statistics.
Length and area measurements derived for the three sand bodies are compared. Of the four shape parameters, the aspect parameter had the least variation, while the roundness/elongation parameter had the most. This implies that the most consistent shape parameter involves manual measurements, i.e., total length and average width. The least consistent shape parameter is roundness/elongation. Sandbars from TOTO are slightly more elongated than from the other two areas, but there is a surprising similarity of shape of individual sand bars between the three areas given that the sand bodies themselves have differences.
Summary of Initial Results
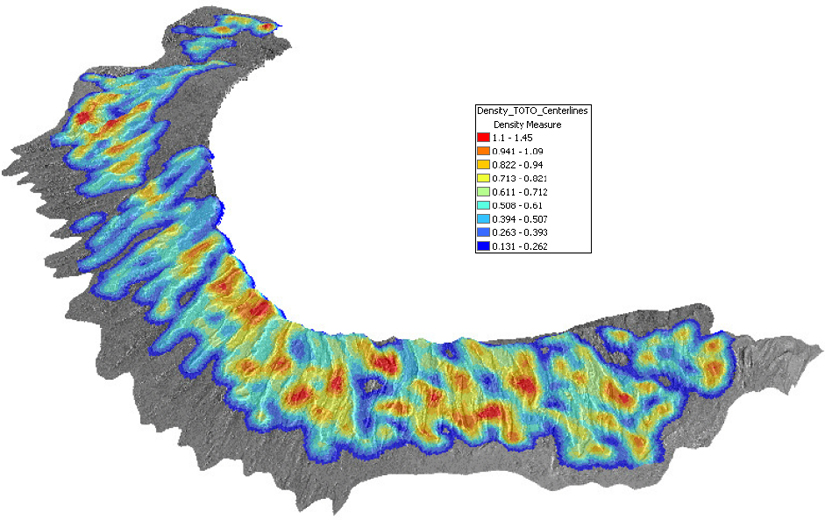 Density of centerlines, TOTO.
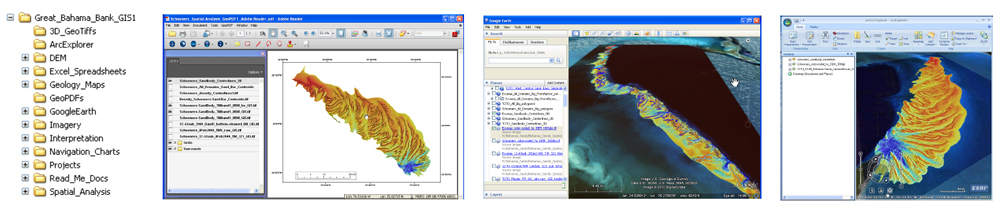 Geospatial data shown in GIS format.
In each of the three cases, the carbonate sand body was interpreted by selecting different portions and different water depth intervals, and these varied features were highlighted for visual analysis and morphometric measurements. Sizes and shapes were compared at a variety of scales, e.g., the total sand body, domains, individual sand bars, and bar crests. We think results such as those highlighted here by the density of centerlines at TOTO add value to the characterization and modeling of carbonate reservoirs and improve our understanding and predictability of reservoir heterogeneity.
Technology transfer - objective is to move the geospatial data from a high-end GIS (TOTO, Schooners, Exumas) into lower cost and more readily available viewers to support training and improve communication.
Copyright © AAPG. Serial rights given by author. For all other rights contact author directly.