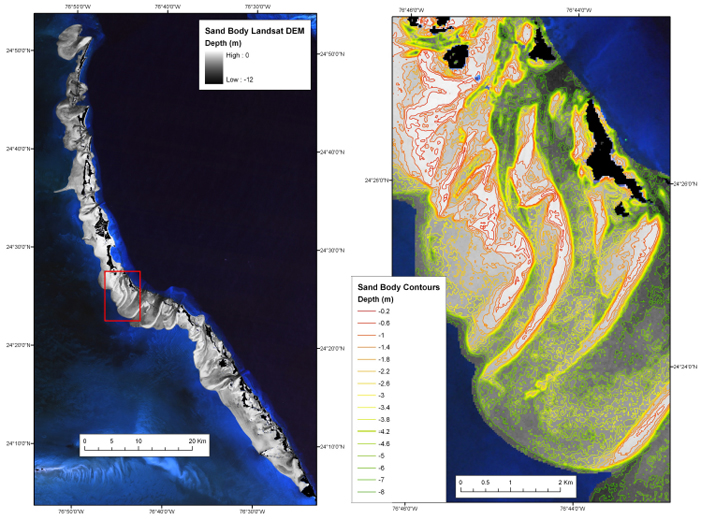
Red outline shows enlarged subarea of Exumas. Contours of the bathymetric DEM are draped over the Landsat color image (enlargement of subarea) (right).
Red outline shows enlarged subarea of Exumas. Contours of the bathymetric DEM are draped over the Landsat color image (enlargement of subarea) (right).