Click to view article in PDF format.
GCConstraining Seismic Interpretation with Aeromagnetic Data*
John W. Peirce1
Search and Discovery Article #40606 (2010)
Posted October 14, 2010
*Adapted from the Geophysical Corner column, prepared by the author and entitled “HRAM Data Gives Perspective,” in AAPG Explorer, September, 2005. Appreciation is expressed to Alistair Brown, editor of Geophysical Corner, and to Larry Nation, AAPG Communications Director, for their support of this online version.
1GEDCO, Calgary, Alberta, Canada ([email protected])
Magnetic data traditionally have been used to map basement faulting, allowing geoscientists to have a better understanding of the structure of the overlying sedimentary section. Recent advances in acquisition, processing and interpretation techniques, however, have made it possible to map intra-sedimentary faulting and fractures as well. HRAM (high-resolution aeromagnetic) data are acquired by flying a plane with a magnetometer approximately 100-150 meters from ground surface over an area of exploration interest on a grid with line spacing of 200-800 meters. When flying close to the ground, the magnetometer senses magnetic variations caused by basement crystalline rocks, as well as the subtle variations from the sedimentary section, near surface geological signals and cultural noise from wells, pipelines, and other ferrous structures. The processing and interpretation of HRAM data becomes a task of integration with all available data. At this point the magnetic data show a general distribution of magnetic properties demonstrating broad regional trends.
|
|
Interpretive Processing and Results It is important to highlight as much structure as possible through interpretive processing. This is accomplished through various filters, creating a montage of several maps. The processing geophysicist uses the power spectrum of the data and available regional geological control to choose different filters to highlight signals of interest. The result is a set of enhanced magnetic anomaly maps that highlight lineaments that are due to geological features in the basement and in the sedimentary section, separated by wavelength (longer wavelengths mean deeper sources; shorter wavelengths mean shallower sources). Further perspective can be added by calculating magnetic depth solutions to see faults and structural grain, and by displaying these in a 3-D visualization cube with the seismic data. There is strength in numbers; the ambiguity of separate interpretations drops dramatically with each constraint from a different type of data interpretation that we include. HRAM data continually prove useful in mapping basement faulting as well as understanding the structural grain of the sedimentary section:
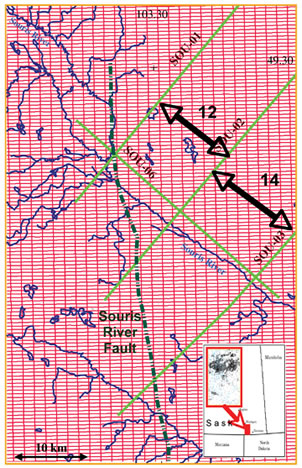
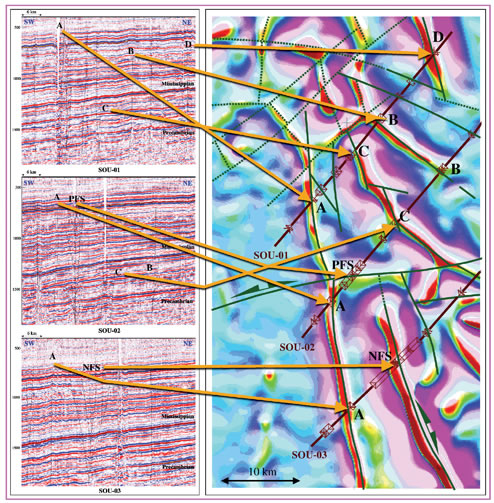
In the IEA Weyburn CO2 sequestration project, a large amount of 2-D seismic data were made available to the project for mapping regional scale faults in the area. The purpose of the mapping was to assess the security of the Geosphere as a container for the injected CO2 gas. The concern about leakage relates to some impurities in the injected gas, which would be detrimental to the environment if they leaked to the surface. Because the faulting patterns were somewhat complicated and the seismic data were relatively widely spaced (Figure 1), we used GEDCO's proprietary HRAM data as an additional constraint to resolve the spatial aliasing of the fault correlations. Figure 2 shows three seismic lines and one filtered version of the magnetic data. There are at least six faults imaged on these three lines, and there is no straightforward correlation of the faults between the lines. The situation is made more complicated because the seismic expressions of the individual faults vary from line to line. Using the HRAM data -- as enhanced by filtering to emphasize shallow signal, the preferred correlation is shown in Figure 2, with fault A being the same on all three seismic images and following the distinct magnetic signature of the fault. This previously unknown fault is now called the “Souris River Fault,” because it offsets the flow of the Souris River from its southeasterly regional flow into a short southerly leg for about 10 kilometers. The fault is clearly present at the basement level on depth-migrated seismic processing, and it penetrates through the entire section to the surface, as evidenced by the course of the Souris River. In addition to demonstrating the utility of using HRAM data to constrain ambiguous seismic interpretations, this project also demonstrates clearly that some basement faults penetrate throughout the section in southeastern Saskatchewan — an important finding for the IEA CO2 sequestration project. Although there is no evidence that this fault is a leakage path from the reservoir to the surface, the possibility of other basement-to-surface faults exists, and each must be tested for gas leakage to ensure the integrity of the reservoir as a long-term storage container.
Copyright © AAPG. Serial rights given by author. For all other rights contact author directly. |